
Let's be honest, marketing without data is just guessing. You're throwing money at different channels—social media, email, Google Ads—and just hoping something sticks. You see clicks and likes, but do you really know which efforts are bringing in customers and which are just noise?
That’s where digital marketing analytics comes in. Think of it as the GPS for your entire marketing strategy. It’s the process that turns a jumble of raw data into a clear story, showing you what’s working, what isn't, and the most direct route to your goals.
What Is Digital Marketing Analytics Really

At its heart, digital marketing analytics is the framework that helps you answer the tough questions. It's about taking all those abstract numbers—website visits, open rates, conversion numbers—and translating them into actionable insights that actually grow your business.
From Guesswork To Growth
Instead of relying on gut feelings, analytics gives you solid evidence to back up your decisions. You move from "I think this ad is working" to "I know this ad generated $10,000 in revenue." That's a powerful shift. It lets you allocate your budget with confidence and, more importantly, prove the value of your work to stakeholders.
By digging into how people actually interact with your brand online, you start connecting the dots between your actions and their results. To get a feel for how this plays out in the real world, it helps to understand the specifics of B2B marketing analytics, which shows how data directly drives strategy in complex sales cycles.
The Core Idea: Digital marketing analytics isn’t just about collecting numbers; it’s about understanding the story those numbers tell about your customers and your business.
This practice is what allows you to pivot on a dime, fine-tune your campaigns in real-time, and squeeze more value out of every dollar you spend. It's the engine that powers modern marketing, revealing things like:
- Which channels drive the most valuable traffic and lead to actual sales.
- What content resonates most with your audience, keeping them engaged.
- How users navigate your website before making a purchase or leaving.
- The true return on investment (ROI) for each of your campaigns.
The Four Levels of Marketing Analytics
Diving into digital marketing analytics is a lot like learning to read a map. When you first start, you can probably only point to where you are right now. But with a bit of practice, you start to see the path you took to get there, predict the best route forward, and even spot potential traffic jams before you hit them. That’s exactly how the four levels of analytics work—each one gives you a more sophisticated view of your marketing world.
The journey from raw data to a real action plan is a progressive one, as this infographic shows.
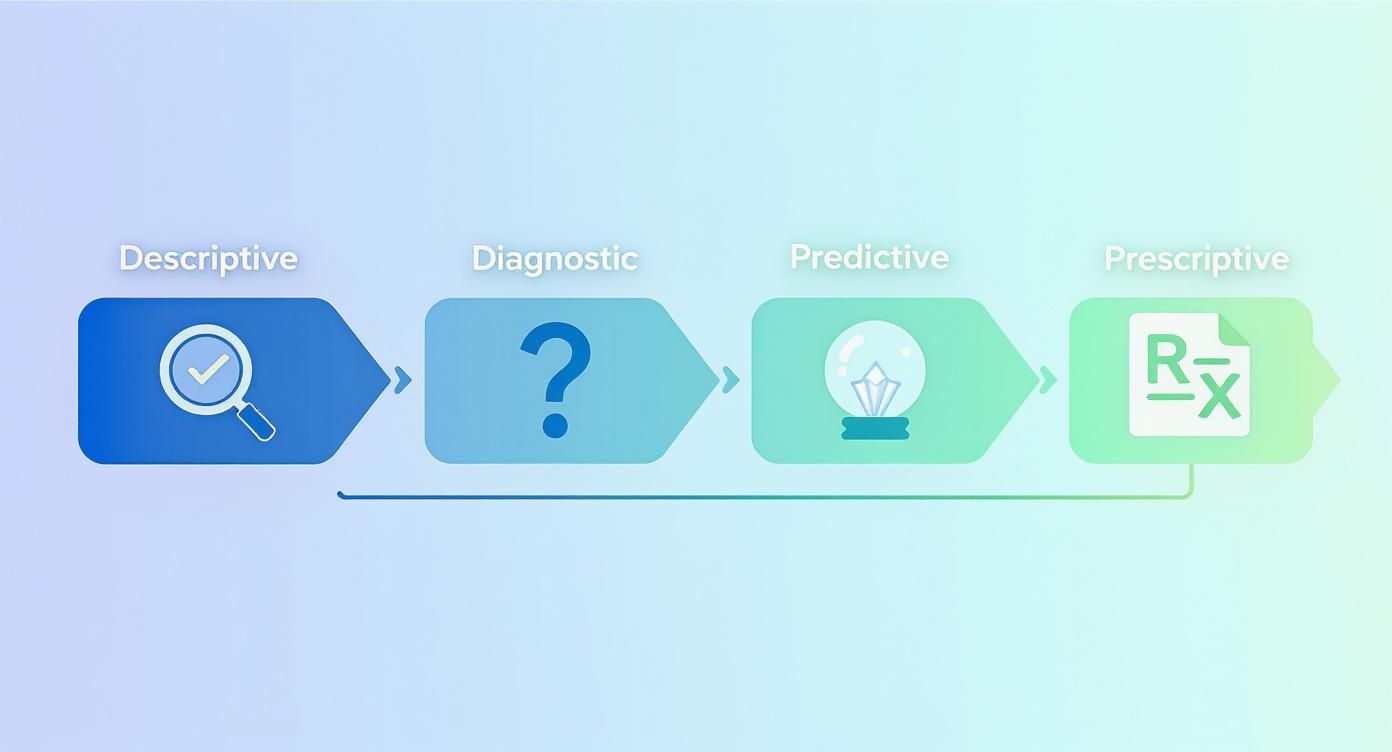
You can see how each level builds on the last, taking you from simply looking at what’s in the rearview mirror to confidently steering toward the future.
Descriptive Analytics: What Happened?
First up is Descriptive Analytics. This is the most basic, foundational level of understanding your data. It's all about looking back at what has already happened and getting the facts straight. Think of it as the "what" in your marketing story.
Most of the reports marketers look at every day fall into this category—things like website traffic summaries, social media engagement stats, or last quarter’s email open rates. It’s the raw data, presented clearly.
- Example: Your monthly report flags that website traffic took a 30% nosedive last week. That's a descriptive insight. It doesn't explain why, it just gives you a hard, objective fact.
Diagnostic Analytics: Why Did It Happen?
Once you know what happened, the natural next question is why. That's where Diagnostic Analytics steps in. This level is all about playing detective—digging deeper into your data to figure out the root cause of a trend or an event.
This goes way beyond just pulling a standard report. It means you have to start connecting the dots, looking at different data sets together, and trying to piece together the story behind the numbers.
Diagnostic analytics is the bridge between seeing a number and actually understanding it. It turns a data point—like a drop in traffic—into a genuine business insight.
- Example: After seeing that 30% drop, you start investigating. You notice the dip lines up perfectly with a competitor launching a huge paid ad campaign targeting your main keywords. Bingo. That’s a diagnostic insight.
Predictive Analytics: What Will Happen Next?
Okay, so you have a solid grip on what happened and why. Now you can start looking ahead. Predictive Analytics uses all that historical data, along with statistical models and machine learning, to forecast what’s likely to happen in the future.
This is where you start anticipating trends, customer behavior, and potential opportunities before they fully materialize. It's about making smart, educated guesses based on the patterns you've already identified in your data.
- Example: Based on your competitor's ad budget and the initial hit you took, your predictive models suggest you're on track for a continued 15-20% traffic loss over the next month if you do nothing.
Prescriptive Analytics: What Should We Do About It?
The final, most advanced stage is Prescriptive Analytics. This level doesn't just predict the future; it tells you what to do about it. It recommends specific actions you can take to either capitalize on an opportunity or head off a problem at the pass.
It’s essentially a data-driven "prescription" for what to do next. The impact here is huge—84% of B2B marketers say analytics helps them build brand awareness, and 51% of businesses are already using AI to make real-time operational tweaks. Those are the kinds of capabilities that fuel prescriptive recommendations. You can see more on how analytics is changing the game in these digital marketing statistics.
- Example: Your analytics tool doesn't just warn you about the traffic loss. It recommends launching a counter-campaign focused on long-tail keywords your competitor is ignoring and suggests shifting 10% of your social media budget to targeted search ads to reclaim your lost ground. Now that's an action plan.
Tracking Metrics That Actually Matter
It's way too easy to get lost in a sea of data. You open your analytics dashboard and see page views, social media followers, and email open rates—but what do those numbers actually mean for your business? The real key to useful digital marketing analytics is learning to separate the interesting stats from the important ones.
This means focusing on metrics that are tied directly to your business goals, not just numbers that look good in a report. A big spike in website traffic is nice, but if none of those visitors ever become customers, it's just a vanity metric. Real success comes from tracking the data that tells a story about growth and profit.
To build a dashboard that actually helps you make decisions, you need to know which key performance indicators (KPIs) are the most important for each channel you're using.
Key Marketing Metrics by Channel
To help you cut through the noise, we've put together a table of the most critical metrics for some of the biggest marketing channels. Think of this as your cheat sheet for focusing on what truly drives results.
| Channel | Metric | What It Measures |
|---|---|---|
| SEO | Organic Traffic | The number of visitors who land on your site from search engines like Google. This is a direct indicator of your search visibility. |
| SEO | Keyword Rankings | Your position in search results for specific keywords. Higher rankings for valuable terms should lead to more qualified traffic. |
| Social Media | Engagement Rate | The percentage of your audience that likes, comments, or shares your content. It shows how well your message is resonating. |
| Social Media | Click-Through Rate (CTR) | The percentage of people who see your post and actually click the link. This is crucial for driving traffic from social to your site. |
| Email Marketing | Conversion Rate | The percentage of email recipients who took a desired action, like making a purchase. This is where the money is made. |
| Email Marketing | List Growth Rate | How quickly your email list is expanding. A healthy growth rate shows sustained interest in what you have to offer. |
| PPC Advertising | Return on Ad Spend (ROAS) | The revenue you generate for every dollar you spend on ads. This is the ultimate measure of an ad campaign's profitability. |
| PPC Advertising | Customer Acquisition Cost (CAC) | The total cost of acquiring one new customer through a specific campaign. The lower, the better—it means your marketing is efficient. |
This table isn't exhaustive, of course, but it's a solid foundation. If you start by tracking these core metrics, you'll be well on your way to making data-backed decisions that actually push your business forward.
A Closer Look at What to Track
Let's break down why these metrics matter channel by channel.
Search Engine Optimization (SEO)
SEO is a long game, and your metrics need to reflect that. Success isn't just about ranking for a keyword; it's about attracting the right kind of traffic that turns into business.
- Organic Traffic: This is your bread and butter—the number of visitors finding you through search engines. It's a direct measure of how visible you are.
- Keyword Rankings: Where you show up in search results for your target terms. Climbing the ranks for valuable keywords is directly tied to getting more qualified visitors.
- Backlink Growth: The number of quality websites linking back to you. Think of backlinks as votes of confidence that boost your site's authority in the eyes of Google.
Social Media Marketing
Your follower count is a classic vanity metric. Honestly, a smaller, highly engaged audience is far more valuable than a huge, silent one.
- Engagement Rate: This is the percentage of your audience that interacts with your content through likes, comments, and shares. It's a clear signal that your content is hitting the mark.
- Click-Through Rate (CTR): The percentage of people who click the link in your post. This is the metric that shows you're successfully moving people from social media over to your website.
A common mistake is chasing vanity metrics like total followers. Instead, prioritize actionable metrics like conversion rate and customer acquisition cost, which directly reflect business health and campaign effectiveness.
Email Marketing
A good open rate just tells you your subject line worked. What happens after the open is what really counts.
- Conversion Rate: The percentage of email recipients who actually completed a goal, like making a purchase or signing up for a demo.
- List Growth Rate: This shows how quickly your email list is growing. A healthy growth rate is a sign of sustained interest in your brand.
Pay-Per-Click (PPC) Advertising
With paid ads, every single click has a cost. Your metrics have to tell you if that investment is actually paying off.
- Return on Ad Spend (ROAS): This is the bottom line—the amount of revenue you earn for every dollar you spend on ads. It’s the ultimate measure of profitability for an ad campaign.
- Customer Acquisition Cost (CAC): The total cost to get a new customer through a specific campaign. A low CAC means your marketing is efficient and effective.
Ultimately, figuring out how to measure digital marketing success comes down to connecting your analytics back to real-world business results. When you focus on these core metrics, you can turn a confusing pile of numbers into a clear roadmap for growth.
Choosing Your Analytics Toolkit
Knowing which numbers to watch is half the battle. The other half is picking the right tools to actually gather and make sense of all that data. The world of digital marketing analytics is packed with options, from free, do-it-all platforms to super-specialized software for specific channels.
Your goal is to build an analytics "stack" that fits your budget but, more importantly, gives you clear answers to your biggest business questions.
For most businesses, this journey starts with one foundational tool. Think of it as the central nervous system for your analytics, pulling data from all over to give you the complete picture.
All-In-One Analytics Platforms
These are the big guns, the primary source of truth for how your website and app are performing. They track who's visiting, where they came from, and what they do once they arrive, giving you a comprehensive look at your digital footprint.
- Google Analytics: This is the industry standard for a reason. It's powerful, free, and often the very first tool any business should set up. It offers incredibly deep insights into your audience, how they find you, and how they behave on your site.
Here’s a peek at a typical Google Analytics dashboard. It’s designed to give you a high-level overview of key website metrics like user engagement and where your traffic is coming from.
This snapshot shows you what’s happening on your site right now—who's active, which pages are popular, and where in the world your visitors are. It's the quickest way to check your site's pulse.
Specialized Analytics Tools
While an all-in-one platform is your foundation, you'll eventually need specialized tools to dig deeper into specific channels. These tools provide the kind of granular detail that broader platforms just can't catch.
- SEO Tools: You can't fly blind when it comes to search engines. Tools like Ahrefs or SEMrush are non-negotiable for tracking keyword rankings, analyzing who's linking to you, and spying on the competition to improve your visibility.
- Social Media Dashboards: Managing social media without a dedicated tool is chaos. Platforms like Sprout Social or Hootsuite bring all your channels into one place, helping you monitor engagement, track follower growth, and actually measure the ROI from your efforts.
- Data Visualization Software: Sometimes, you need to pull data from everywhere and tell a story with it. That's where tools like Tableau or Power BI come in. They turn messy spreadsheets into clear, interactive dashboards that make insights obvious.
The dominance of a few tech giants heavily shapes this landscape. Alphabet (Google's parent company) is on track to pull in over $200 billion in global digital ad revenue by 2025. This means platforms like Google Analytics aren't just tools; they're central to how the entire industry works and innovates.
You can learn more about how these platforms influence the market in these digital marketing statistics. This concentration of power has a silver lining, though—it gives even the smallest businesses access to incredibly powerful analytics, leveling the playing field in a big way.
How Analytics Drives Smarter Marketing Decisions
 Digital marketing analytics is what turns all that raw data into your secret weapon for growth. It’s the difference between throwing money at the wall and hoping something sticks, and making calculated decisions that you know will pay off. By connecting your marketing actions to actual results, you can finally make smarter, faster, and more profitable choices.
This isn't just another industry buzzword; it's a fundamental shift in how successful businesses operate. In fact, digital marketing analytics has exploded into a massive industry, valued at around $7 billion in 2023 and projected to hit $23 billion by 2033. That kind of growth tells you everything you need to know about its importance. For more on this market surge, check out the report from DataHorizzon Research.
Maximizing Your Return on Investment
One of the first things you'll notice when you embrace analytics is how much smarter you get with your budget.
Let's say you're running two ad campaigns—one on Facebook, one on Google. Your analytics dashboard shows that while both are getting clicks, the Google campaign is actually driving 75% of your sales.
Without that insight, you'd probably keep splitting your budget 50/50. With it, you can confidently pull funds from the underperforming Facebook campaign and pour them into the one that’s actually making you money. Just like that, you’ve boosted your return on investment (ROI). Analytics gives you the proof you need to stop wasting money and double down on what works.
By connecting spending to outcomes, digital marketing analytics allows you to justify every budget decision with hard data, turning marketing from a cost center into a predictable revenue driver.
To really get the most out of this, you'll want to get comfortable with the whole idea of data-driven decision-making. It’s a mindset that grounds your entire strategy in solid evidence instead of gut feelings.
Enhancing the Customer Experience
Beyond just ROI, analytics gives you a clear window into how people actually behave on your site. By tracking how users click around and navigate, you can spot friction points and opportunities you'd otherwise miss.
For example, if you see a ton of people abandoning their shopping carts right on the shipping page, that’s a huge red flag. It’s a signal to simplify that step, make the costs clearer, or maybe offer a free shipping threshold.
This kind of understanding helps you pinpoint which touchpoints in the customer journey are working and which are causing frustration. We get into the weeds on this in our guide on what is marketing attribution. Making these small, data-informed tweaks leads to a smoother experience for your customers, which builds trust and keeps them coming back.
Common Questions About Marketing Analytics
As you start digging into digital marketing analytics, you're bound to have questions. This stuff can feel complicated at first, and it's always changing. To help you get your bearings, we've pulled together answers to some of the most common questions we hear from marketers.
Think of this as a quick-start guide to clear up the confusion. We'll cover everything from how often you should be checking your numbers to what separates key terms that sound suspiciously similar, giving you the confidence to start putting this knowledge to work.
How Often Should I Check My Marketing Analytics?
There's no single "right" answer here—it all depends on the metric you're looking at and what you've got going on. A good rule of thumb is to match your check-in schedule to the speed of the channel.
For the big-picture, slow-moving numbers like your overall organic traffic or total leads for the month, a weekly or bi-weekly check-in is usually plenty. This gives you enough data to see real trends without getting jumpy over minor daily ups and downs.
But for fast-paced campaigns—like a new product launch or a Google Ads push—you’ll want to be in there daily. Metrics like click-through rate (CTR), cost per click (CPC), and conversion rates can change in a heartbeat. Daily monitoring lets you make quick adjustments, like killing a bad ad or shifting budget to a winner, before you waste any more money.
The real goal is to get into a consistent rhythm. When checking your data becomes a proactive habit instead of a reactive chore, you start making smarter decisions before small problems turn into big ones.
What Is the Difference Between Marketing Analytics and Web Analytics?
This is a classic point of confusion, but the difference is actually pretty simple. Think of it like this: web analytics is one important piece of the much larger marketing analytics puzzle.
Web analytics is hyper-focused on what happens on your website. It's all about metrics like:
- Page Views: How many times a page on your site was seen.
- Bounce Rate: The percentage of people who landed on a page and left without doing anything else.
- User Flow: The paths people take as they click through your site.
Digital marketing analytics, on the other hand, zooms out to see the whole picture. It takes all your web analytics data and layers in information from every other channel you're using—social media, email, paid ads, you name it. This gives you a complete, 360-degree view of what's working and what's not.
It answers the bigger questions, like, "Did our last email blast actually lead to more sales on the website?" or "Which social media platform is sending us visitors who actually sign up?" It’s the framework that helps you follow a customer's entire journey, not just the last few steps they took on your site.
Can a Small Business Use Digital Marketing Analytics Effectively?
Absolutely. In fact, for a small business where every dollar and customer is precious, analytics isn't just a nice-to-have; it's a must-have. You don't need a huge budget or a data science degree to make it work for you.
Many of the best tools out there, like Google Analytics and Google Search Console, are totally free. The trick for a small business is to resist the urge to track every single metric under the sun. Instead, zero in on a handful of numbers directly tied to your most important goals.
For example, if your main goal is getting more leads through your website, you'd want to focus on:
- Website Traffic Sources: Where are people coming from? (Google, Facebook, etc.)
- Conversion Rate on Contact Forms: Of the people who visit your contact page, how many actually fill out the form?
- Engagement on Your Main Social Channel: Which posts are people actually liking, sharing, and commenting on?
By keeping your focus on a few high-impact metrics, you can make real improvements without getting buried in data. Understanding these numbers is the key to measuring your return on marketing investment and making sure all your hard work is actually paying off.
At Up North Media, we specialize in turning complex data into clear, actionable strategies that drive real growth. If you're ready to move beyond guesswork and start making data-driven decisions that boost your bottom line, we're here to help.