
Measuring your digital marketing success isn't just about crunching numbers. It’s about figuring out what actions actually drive revenue and growth, moving past the surface-level stuff to see the real impact.
Defining What Marketing Success Actually Means
Before you can measure anything, you have to know what you're measuring against. Success in digital marketing isn't a one-size-fits-all concept.
A local e-commerce store selling handmade goods has a completely different goal than a national B2B software provider. One is probably obsessed with direct online sales, while the other is focused on generating qualified leads for its sales team.
That’s why the first step is always connecting your marketing activities directly to your core business objectives. Without that link, you risk chasing "vanity metrics"—impressive-sounding numbers like social media likes or impressions that don’t actually contribute to your bottom line. High engagement is nice, but it's meaningless if it doesn't translate into real outcomes.
Aligning Goals with Business Outcomes
Your marketing goals should be a direct reflection of what the business needs to achieve. Are you trying to grow market share, increase customer loyalty, or break into a new demographic? Each of these objectives demands a distinct marketing approach and, therefore, a unique set of success metrics.
Start by asking what the primary commercial goal is for the next quarter or year. Then, work backward to figure out which marketing actions will help you get there.
- For Revenue Growth: Your main goal is likely driving direct sales or generating high-quality leads.
- For Brand Awareness: Success might be measured by a jump in organic website traffic, social media reach, and brand-name search volume.
- For Customer Loyalty: You'll want to focus on metrics like repeat purchase rate, customer lifetime value (LTV), and engagement with post-purchase content.
Getting this alignment right is crucial. At the heart of all digital marketing is the question of how to measure marketing campaign success effectively, and the answer always starts with your specific business goals.
The most common mistake is measuring everything and understanding nothing. True success is defined by tracking the few metrics that directly predict business growth, not the many that simply describe activity.
Moving Beyond Generic Metrics
Once your objectives are clear, you can pick KPIs that genuinely show progress. This means getting specific. Instead of just "more website traffic," a better goal is "increase organic traffic from our target demographic by 20% this quarter." That kind of specificity makes your measurements meaningful.
For instance, a B2B company might live and die by its Marketing Qualified Leads (MQLs). Their entire content strategy, from blog posts to webinars, would be judged on its ability to generate MQLs. On the flip side, an online retailer would obsess over its Conversion Rate and Average Order Value (AOV).
A deep understanding of your ideal customer is essential for setting these specific goals. To learn more about this process, check out our guide on how to create buyer personas. This helps ensure your marketing efforts and measurement strategy are perfectly aligned with the people you’re trying to reach.
Choosing the right metrics gives you a clear, unbiased view of what’s working, allowing you to double down on effective strategies and cut what isn't.
Tracking Traffic and Audience Engagement
Getting people to your website is a huge win, but it's really just the first step. Raw traffic numbers don't tell you the whole story—not by a long shot. The real magic happens when you start to understand who these visitors are, where they're coming from, and what they actually do once they land on your site. This is how you shift from just counting hits to truly knowing your audience.
Tools like Google Analytics 4 (GA4) are non-negotiable here. Think of GA4 as the command center for your website's audience behavior. It helps you piece together the narrative behind the numbers, showing you which channels are bringing in not just bodies, but your most valuable visitors.
This dashboard from Google Analytics 4 gives you a quick snapshot of what’s happening on your site over a certain period.

From a single glance, you can see top-level metrics like total users, engaged sessions, and average engagement time. It's the perfect high-level health check for your site.
Analyzing Your Traffic Sources
Let's be clear: not all traffic is created equal. A visitor who finds you after typing a super-specific question into Google is probably more qualified than someone who mindlessly clicked on a broad social media ad. Understanding the difference is fundamental to knowing if your marketing is actually working.
When we talk about measuring digital marketing success, we're really talking about monitoring the right key performance indicators (KPIs), and traffic sources are foundational. You need to know where your visitors are coming from—organic search, paid ads, social media, or referral links. This breakdown is what lets you double down on what's working and pull back on the channels that are just burning cash.
Your traffic will generally fall into one of these buckets:
- Organic Search: These are visitors who find you through a search engine like Google. High organic traffic is a fantastic sign that your content is relevant and your SEO game is strong.
- Paid Search: This is traffic from people clicking on your ads on platforms like Google Ads. It's highly targeted, but it comes with a direct cost for every click.
- Social: Any visitor who arrives from a social media platform, whether from an organic post or a paid ad. This channel is amazing for building brand awareness and community.
- Referral: This happens when someone clicks a link to your site from another website. It’s a powerful signal of your authority and can bring in a super relevant audience.
- Direct: These are the folks who type your URL directly into their browser. They often represent your most loyal audience members—the ones who already know and trust your brand.
By digging into which sources bring in the most engaged users, you can start making much smarter marketing decisions. For instance, if you notice that traffic from a guest post you wrote has an unusually high conversion rate, that’s a flashing neon sign telling you to do more collaborations with that publication.
Decoding Key Engagement Metrics
Once you get visitors to your site, the next big question is: do they actually care about what they find? Engagement metrics are your feedback loop. They tell you if your content is hitting the mark or if people are taking one look and bouncing.
An engaged user is a potential customer. Low engagement is a massive warning sign that there's a disconnect between what your audience wants and what your website is giving them.
In GA4, a few key engagement metrics tell most of the story:
- Engaged Sessions: This isn't your grandma's "bounce rate." A session counts as "engaged" if it lasts longer than 10 seconds, includes a conversion event, or has at least 2 pageviews. It’s a much better way to measure real interaction instead of just a quick exit.
- Average Engagement Time: This metric shows you how long your website was the primary focus in a user's browser. A higher number here is a great indicator that your content is compelling enough to hold someone's attention.
- Event Count: With GA4, pretty much any interaction can be tracked as an "event"—clicking a button, playing a video, submitting a form, you name it. Tracking specific events helps you understand exactly how people are interacting with your pages.
Let's put this into a real-world scenario. Say you launch a new paid social campaign and see a massive spike in traffic. Looks great on the surface, right? But then you dig into GA4 and see the Average Engagement Time is just a few seconds, and almost none of the visits qualify as Engaged Sessions.
That insight immediately tells you something is broken. The ad might be great, but the landing page is failing to deliver on the promise, causing people to leave right away. Without looking at engagement, you might have wasted a ton of money scaling up a campaign that was doomed from the start. This is what it really means to measure digital marketing in a way that leads to actual, actionable improvements.
Measuring Conversions and Acquisition Costs

Traffic and engagement are great starting points, but they don't keep the lights on. The real test of your marketing is whether it can turn casual visitors into actual customers. This is where conversion tracking becomes your best friend—it’s the bridge between audience interest and real business results.
A conversion is simply any valuable action a user takes on your site. We tend to focus on the big ones, like a completed purchase, which we call a macro-conversion. But don't overlook the smaller steps, like a newsletter signup or an ebook download. These micro-conversions are crucial signals that someone is moving down the funnel. Tracking both gives you the full story.
From Clicks to Customers: Understanding Conversion Rate
Your Conversion Rate is arguably one of the most important numbers in your entire marketing toolkit. It's the percentage of visitors who actually follow through on a specific goal you've set. The math is simple:
(Total Number of Conversions / Total Number of Visitors) * 100 = Conversion Rate
Let's say your landing page got 2,000 visitors last month, and 50 of them signed up for a demo. Your conversion rate for that goal is 2.5%. This single number gives you a powerful snapshot of how persuasive your page is.
And it's not just a vanity metric. Recent surveys show that 31% of analysts see sales, leads, and conversion rates as the ultimate gauge of marketing success. With more people buying directly through channels like social media—a whopping 59% did so in 2023—tracking conversions across every touchpoint is non-negotiable.
Improving this rate is the most direct path to boosting revenue without spending a dime more on traffic. If you want to go deeper, we've put together a guide on exactly how to improve website conversion rates.
When you're deciding what to track, it's helpful to align your metrics with your overarching business goals. What one business considers a key conversion, another might see as a secondary signal.
The table below breaks down which conversion metrics you should focus on based on what you're trying to achieve.
Key Conversion Metrics by Marketing Goal
| Business Goal | Primary Conversion Metric | Secondary Conversion Metrics |
|---|---|---|
| Increase Sales (E-commerce) | Completed Purchases | Add to Cart, Product Page Views, Wishlist Adds |
| Generate Leads (B2B/Service) | Form Submissions (Demo, Quote) | Gated Content Downloads, Newsletter Signups |
| Boost Brand Awareness | Social Media Shares, Video Views | Time on Page, New vs. Returning Visitors |
| Build a Community | Newsletter/Email Subscriptions | Comments on Blog Posts, Forum Registrations |
Ultimately, choosing the right metrics comes down to understanding your customer journey and identifying the key actions that signal progress toward your main objective.
Calculating Customer Acquisition Cost
A high conversion rate feels great, but it's only half the story. You also have to know what it costs to get each of those customers. That brings us to Customer Acquisition Cost (CAC), a metric that tells you a lot about the financial health of your marketing efforts.
CAC is the total amount you spend on sales and marketing to land one new customer. The formula is just as straightforward:
Total Marketing & Sales Spend / Number of New Customers Acquired = CAC
Imagine you spent $5,000 on a Google Ads campaign last month and it brought in 50 new customers. Your CAC for that campaign is $100. Now you have a clear baseline for what you're paying to grow.
A low CAC is a sign of efficient, scalable marketing. A high CAC can be a red flag, indicating that your growth is coming at an unsustainable price—even if your conversion rates look good.
The Profitability Puzzle: A Real-World Scenario
Let's put these two metrics together to see how they work in the real world. An e-commerce brand selling custom phone cases launched a Facebook ad campaign. At first glance, the results looked fantastic:
- Ad Spend: $2,000
- Website Clicks: 4,000
- New Customers: 200
- Conversion Rate: 5% (200 customers / 4,000 clicks)
A 5% conversion rate is pretty stellar for most e-commerce stores! The team was popping the champagne. But then they calculated their CAC, and the story changed completely.
Their CAC was $10 ($2,000 ad spend / 200 new customers). The problem? The average order value for a phone case was only $25. After factoring in the cost of goods, their profit per sale was just $8.
This meant they were spending $10 to acquire a customer who only generated $8 in profit. They were losing $2 on every single sale from this "successful" campaign. The high conversion rate had masked a fatal flaw in their unit economics. By focusing only on conversions, they missed the bigger picture and were literally paying for customers who were costing them money.
This is exactly why you have to measure conversions and acquisition costs side-by-side. It's the only way to ensure your growth is actually profitable and sustainable.
Calculating Your Marketing ROI and ROAS
Alright, you've tracked traffic, engagement, and conversions. Now for the million-dollar question: is any of this actually making money?
Answering this with confidence is what separates the pros from the amateurs. It means moving beyond vanity metrics and getting real about financial performance. In the world of marketing, that conversation always comes down to two acronyms: Return on Investment (ROI) and Return on Ad Spend (ROAS).
People throw these terms around interchangeably, but they tell very different stories. Getting the distinction right is crucial for having productive chats with the leadership team and making smart budget decisions.
Distinguishing Between ROI and ROAS
Think of ROAS as a tactical, in-the-weeds metric. It’s laser-focused on the gross revenue you get back from a specific ad campaign. It answers one simple question: "For every dollar we just pumped into these ads, how many dollars in revenue did we get back?"
The formula is clean and simple:
ROAS = Revenue from Ad Campaign / Cost of Ad Campaign
So, if you spend $1,000 on a Google Ads campaign and it brings in $5,000 in sales, your ROAS is 5:1. It's a fantastic way to quickly judge if an ad set or a social media push is working.
ROI, on the other hand, is the strategic, big-picture metric. It measures the total profit of an investment against its total cost. When you're calculating marketing ROI, "cost" is a much bigger bucket than just ad spend. It should include everything:
- Software and tool subscriptions
- Salaries for your marketing team
- Content creation costs (freelancers, designers, etc.)
- Ad spend across every single channel
The formula for ROI tells you if you're actually profitable:
ROI = (Net Profit from Marketing - Total Marketing Cost) / Total Marketing Cost
A positive ROI means your marketing department, as a whole, is a profit center, not a cost center. For a deeper dive, our guide has more examples on how to measure ROI properly.
ROAS tells you if a specific ad is generating revenue. ROI tells you if your entire marketing operation is generating profit. You absolutely need both to see the full financial picture.
The Power of Customer Lifetime Value
While ROI and ROAS give you a critical snapshot, they often focus on the immediate return from that first sale. But what about the customers who come back? This is where Customer Lifetime Value (LTV) becomes one of the most powerful numbers you can track.
LTV is all about predicting the total profit your business will earn from a customer over their entire relationship with you. A customer who makes an initial $50 purchase but comes back every month for two years is infinitely more valuable than a one-and-done customer who spends $200.
When you start tracking LTV, your whole mindset shifts from short-term customer acquisition to long-term relationship building. Once you know your average LTV, you can make much smarter calls about how much you’re willing to spend to bring a new customer in the door.
This infographic breaks down the journey from setting your goals to calculating the final return on your investment.
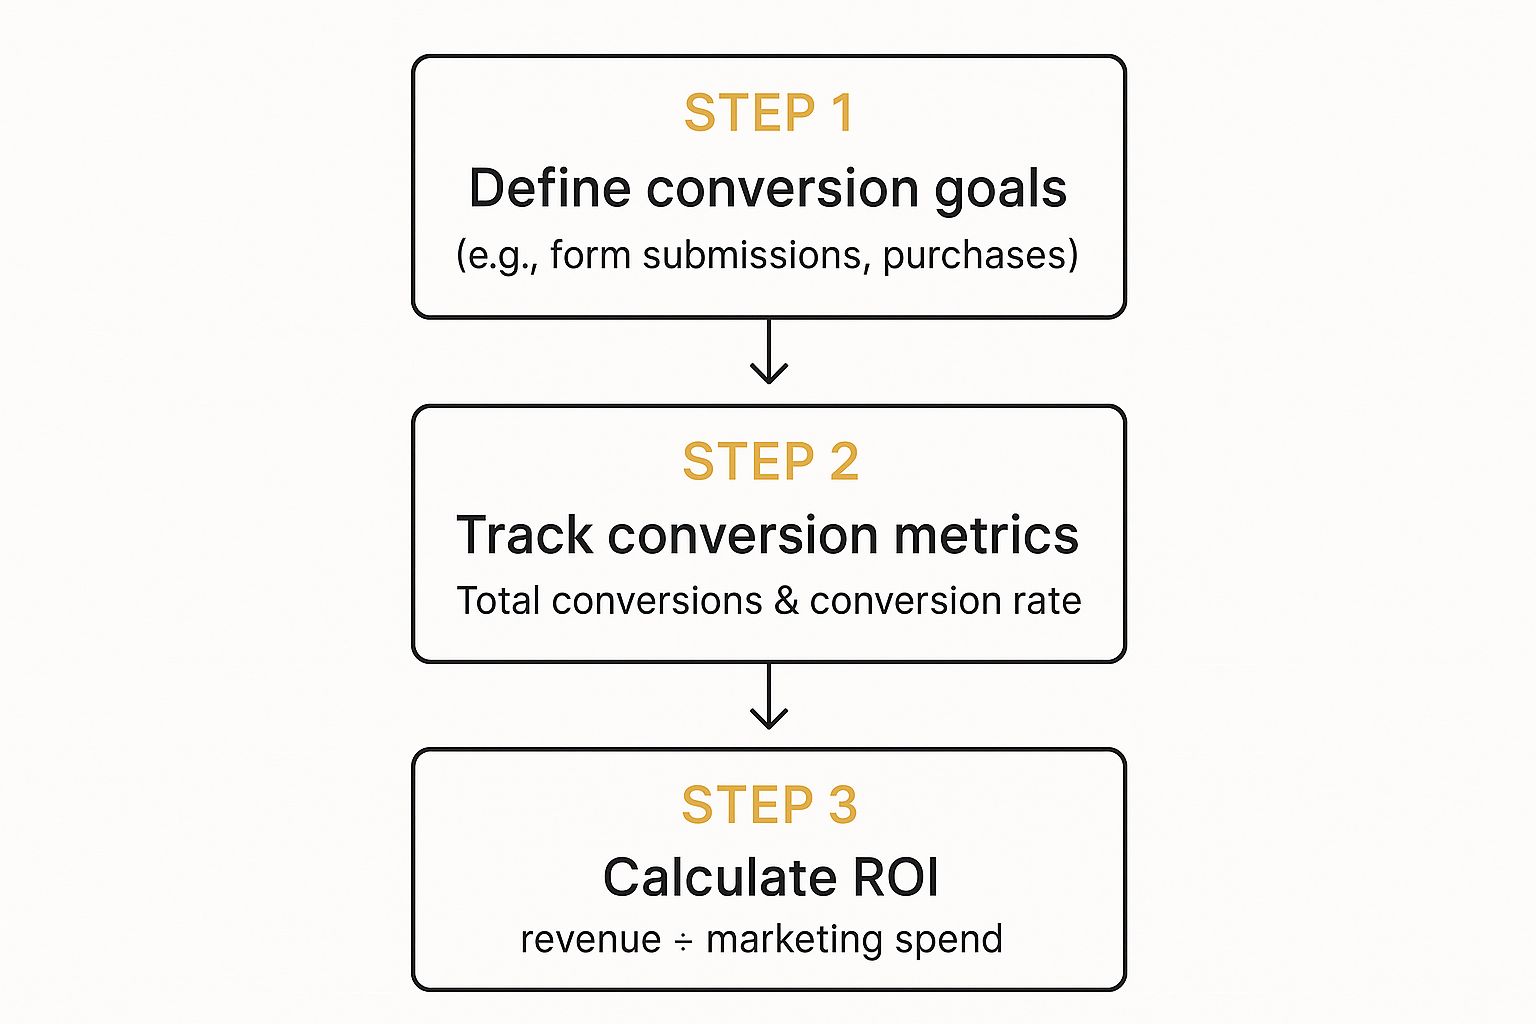
As you can see, defining what you want to achieve is the essential first step. Without it, you can't effectively track conversions or measure the real financial success of your work.
The LTV to CAC Ratio: The Ultimate Health Metric
Now for the magic. The real test of your business model's health is when you compare your LTV to your Customer Acquisition Cost (CAC).
The LTV:CAC ratio is a brutally honest indicator of your long-term viability. It tells you exactly how much value you're generating from each customer compared to what you spent to get them.
- A ratio of 1:1 means you're breaking even. You're on a treadmill, not growing. This is a dangerous place to be.
- A ratio below 1:1 means you're actively losing money with every new customer you sign. Yikes.
- A healthy ratio is generally considered 3:1 or higher. This means for every dollar you spend to get a customer, you get three dollars back over their lifetime. That's a sustainable business.
In today's economy, marketing budgets are under a microscope. Global digital ad spending hit nearly $733 billion in 2023, but with many budgets shrinking in 2024, the pressure to justify every single dollar is intense.
The companies that can connect metrics like LTV and ROAS to overall business performance are the ones that will thrive. By calculating ROI, ROAS, and the LTV:CAC ratio, you elevate your measurement strategy from just tracking clicks to proving the financial contribution of your marketing. You start speaking the language the C-suite understands.
Building Actionable Reports and Dashboards
Raw data is just a collection of numbers. To really know if your marketing is working, you have to turn that data into a clear story that helps you make smart decisions. That’s where actionable reports and dashboards come in—they cut through the noise, helping you see what’s working and spot opportunities at a glance.

The goal isn't to create a sprawling spreadsheet that no one ever reads. It’s to build a living tool that surfaces the most critical information without overwhelming everyone. Tools like Google Looker Studio are perfect for this, letting you pull data from multiple sources into one clean, visual interface.
Tailoring Reports for Your Audience
One of the biggest mistakes I see is creating a one-size-fits-all report. The granular, channel-specific data your marketing team needs to tweak campaigns is way too much for your CEO, who probably just wants to see the high-level ROI.
Effective reporting means giving people the information they care about most.
- For the Marketing Team: This is where you get into the weeds. Focus on operational metrics like Click-Through Rates (CTR) on specific ads, conversion rates by landing page, and engagement on social media posts. This is the stuff they need to make day-to-day optimizations.
- For Leadership/C-Suite: Keep it high-level and tied directly to business outcomes. They need to see the big picture—metrics like overall Marketing ROI, Customer Acquisition Cost (CAC), and the LTV:CAC ratio. Your job here is to connect marketing spend to revenue and profit.
- For the Sales Team: Bridge the gap between what marketing does and what sales needs. Share data on Marketing Qualified Leads (MQLs), which lead sources are performing best, and which campaigns are driving the most sales-ready prospects.
This targeted approach ensures everyone gets the info they need to do their job better, without getting lost in irrelevant details.
Designing a Dashboard That Tells a Story
A great dashboard doesn't just dump data on a screen; it guides you toward an insight. The key is picking the right visualization for the right metric. To get a better handle on visualizing your data, checking out a solid social media analytics dashboard guide can be a huge help.
Here are a few best practices I’ve learned for building a dashboard that actually communicates something useful:
- Use Trend Lines for Progress: Line charts are perfect for showing how a key metric like organic traffic or lead volume has changed over time. It immediately tells you if you're heading in the right direction.
- Bar Charts for Comparisons: Trying to see which social channel is driving the most conversions? A simple bar chart is the clearest way to compare performance across different categories.
- Scorecards for Instant KPI Updates: Put your most important KPIs—like total revenue or conversion rate—in big, bold scorecards right at the top. This gives anyone who looks at the dashboard an instant health check of your marketing performance.
- Pie Charts for Proportions: Use pie or donut charts to show the percentage breakdown of things like traffic sources or conversions by device. Just don't cram too many slices in there, or it becomes unreadable.
The best dashboards are designed to answer questions, not just display numbers. Before you add a chart, ask yourself, "What is the most important question this visual is supposed to answer?" and design around that.
By combining the right metrics with clean, intuitive visuals, you create more than just a report. You build a decision-making engine that turns complex data into clear, actionable steps. This is how you move from just collecting information to using it as a strategic tool for growth—which is the entire point. Your dashboard becomes the command center for your entire marketing operation.
Common Questions About Measuring Marketing
Once you start digging into your marketing data, a few questions always seem to pop up. It's easy to get tangled up in the world of analytics, but the answers are usually more straightforward than they seem. Let's clear up some of the common sticking points so you can build a measurement strategy that you actually trust.
Getting these fundamentals right will give you a ton more confidence when you’re analyzing performance and sharing results.
What Is the Difference Between a Metric and a KPI?
This is a classic, and the distinction is super important. Think of it like this: a metric is just about any piece of data you can track. Website visitors, email open rates, social media followers—those are all metrics. There are thousands of them out there.
A Key Performance Indicator (KPI), on the other hand, is one of the few special metrics you've hand-picked because it directly measures how you’re progressing toward a critical business goal.
For example, "total website visitors" is just a metric. It's a vanity number. But if your main goal is to increase organic visibility, then "new users from organic search" becomes a KPI. All KPIs are metrics, but very few metrics are important enough to be KPIs. Your job is to ignore the noise and focus on the handful that truly move the needle.
A metric tells you what happened. A KPI tells you if you're getting closer to your most important business objective. Choosing the right KPIs is the difference between simply collecting data and making strategic decisions.
How Often Should I Check My Marketing Metrics?
Honestly, the right answer here depends entirely on the metric's "velocity"—how quickly it changes and, more importantly, how fast you can actually do something about it. You definitely don’t need to check everything every single day.
The key is to create a reporting rhythm that matches your ability to make meaningful changes based on what the data is telling you.
- Daily Checks: This is really just for fast-moving paid campaigns. You need to keep a close eye on metrics like Cost Per Click (CPC) and daily ad spend to prevent budget blowouts and jump on immediate opportunities.
- Weekly Checks: This is the sweet spot for channels with a bit more of a slow burn, like SEO and content marketing. Tracking things like organic traffic, keyword rankings, and lead generation on a weekly basis helps you spot trends without overreacting to normal daily ups and downs.
- Monthly or Quarterly Checks: These are reserved for the big-picture, strategic stuff. Your overall Marketing ROI, Customer Lifetime Value (LTV), and Customer Acquisition Cost (CAC) are best reviewed monthly or quarterly to gauge the overall health of your marketing engine.
What Are the Essential Tools for Measuring Marketing Success?
The marketing tech world is massive, but you can get incredibly far with just a core stack of essential tools. You don't need dozens of subscriptions to get started.
Most businesses can build a seriously powerful measurement foundation with just a few key platforms:
- Website Analytics: Google Analytics 4 is completely non-negotiable. It's the source of truth for understanding how people find and interact with your website.
- Customer Relationship Management (CRM): A platform like HubSpot or Salesforce is vital for connecting a marketing activity (like a form submission) to an actual sales outcome. This is how you close the loop and calculate what your real ROI is.
- Native Platform Analytics: Every channel you use has its own built-in analytics. Google Ads, Meta Business Suite, and LinkedIn Campaign Manager all provide the granular data you need to optimize campaigns right where they live.
- Data Visualization: A tool like Google Looker Studio can be a game-changer. It pulls data from all your other sources into one unified, easy-to-read dashboard. It's how you turn complicated spreadsheets into clear, actionable stories that your team can actually understand.
At Up North Media, we specialize in transforming complex data into clear, data-driven strategies that accelerate growth. If you're ready to build a measurement framework that delivers measurable ROI, schedule your free consultation with our experts today. Discover how our SEO and web development services can boost your revenue at https://upnorthmedia.co.