
If you're trying to boost your website's conversion rates, the first step isn't to start changing buttons or rewriting headlines. It's to figure out exactly where you stand right now.
Trying to optimize without a clear starting point is like driving in a new city without a map. You'll definitely be busy, but you’ll have no idea if you're actually getting closer to your destination. The goal here is to stop guessing and start knowing. We need to move past fuzzy "vanity metrics" like total traffic and dig into the data that actually impacts your bottom line.
This all starts with a proper conversion audit to establish your baseline performance. Don't worry, this isn't about getting lost in endless spreadsheets. It's about pinpointing the few key performance indicators (KPIs) that truly define success for your specific business.
Get a Handle on Your Key Conversion Metrics
First things first: what does a "conversion" even mean for your website? Is it a completed sale? A submitted contact form? Maybe it's a newsletter signup or someone starting a free trial. You have to define this before you can measure it.
Once you know what you're aiming for, you can start tracking the right metrics in a tool like Google Analytics.
A dashboard like this gives you a high-level view of where your users are coming from and how they're behaving, which is crucial for identifying which channels bring you the most valuable traffic.
To get started, you don't need to track everything. Just focus on a few essentials:
- Goal Completions: This is the raw number of times users took the action you want them to take.
- Conversion Rate: The percentage of your total visitors who actually complete that goal. This is your core number.
- Funnel Drop-Off Rate: Where are people giving up? You need to know at which step they abandon the process, whether it's the cart page or a form field.
- Cost Per Acquisition (CPA): Simply put, how much are you paying in marketing spend to get one new customer?
This data gives you the what, how, and where of your conversions. For instance, you might pull up your analytics and discover that mobile users are converting at half the rate of desktop users. Just like that, you've uncovered a massive opportunity for improvement.
To help you get started, here are some of the most fundamental conversion metrics you should be tracking from day one.
Essential Conversion Metrics to Start Tracking
This table outlines the foundational metrics for auditing your website's current conversion performance.
| Metric | What It Measures | Why It's Important |
|---|---|---|
| Conversion Rate | The percentage of visitors who complete a desired goal (e.g., purchase, signup). | It's the ultimate measure of your website's effectiveness at persuading visitors to act. |
| Bounce Rate | The percentage of visitors who leave your site after viewing only one page. | A high bounce rate can indicate poor landing page relevance, bad UX, or slow load times. |
| Average Session | The average amount of time visitors spend on your site during a single visit. | Longer sessions often correlate with higher engagement and a greater likelihood to convert. |
| Pages Per Session | The average number of pages a visitor views before leaving your site. | This helps gauge how engaging your content and navigation are. More pages can mean more interest. |
| Funnel Drop-Off | The percentage of users who leave at each step of your conversion funnel. | Pinpoints the exact friction points in your user journey that are costing you conversions. |
Focusing on these core numbers will give you a clear, actionable picture of your current performance without overwhelming you with data.
Set Realistic Goals Using Industry Benchmarks
Once you have your baseline numbers, you need context. Is your 2% conversion rate amazing or terrible? The truth is, it depends on your industry.
Knowing what are good conversion rates and industry benchmarks is essential for setting realistic, achievable goals.
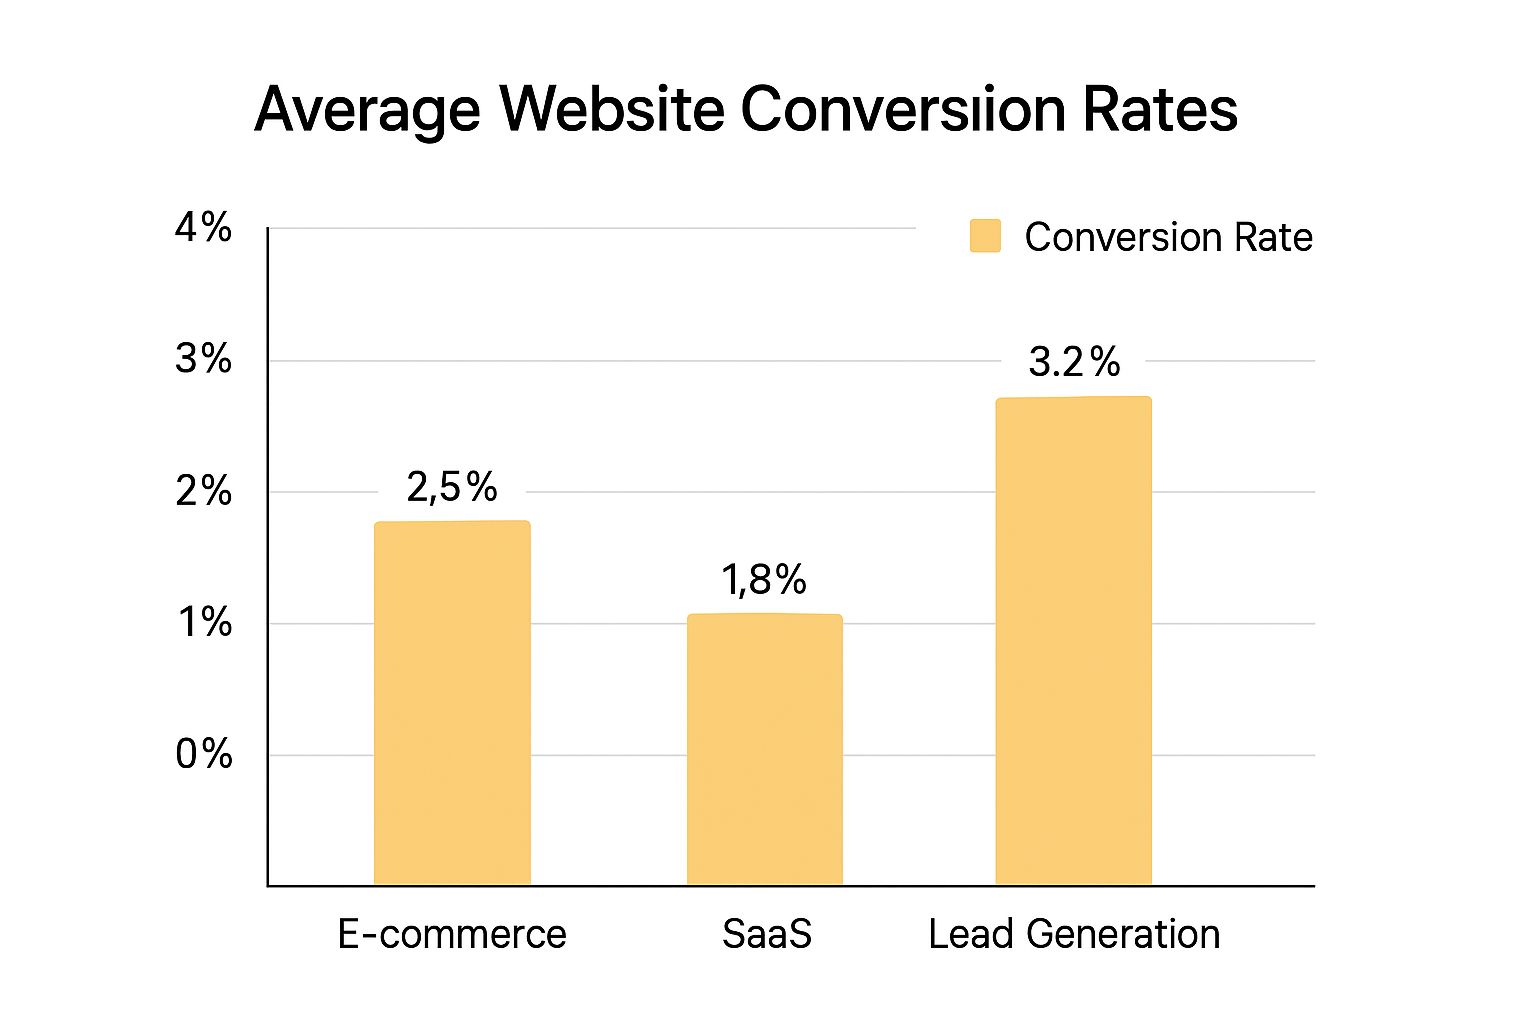
A "good" conversion rate varies wildly. For example, some studies show that while a healthy eCommerce conversion rate hovers around 2.5% to 3%, the average online store is actually sitting at a mere 1.4%. If you can get your rate above 3.2%, you’re already in the top 20% of performers in that space.
By understanding both your own data and where you stack up against the competition, you can build a practical roadmap for improvement. A realistic goal isn't just a random number you pull out of thin air—it's an informed target that will guide your entire optimization strategy from here on out.
Finding and Fixing User Friction Points

So you've got your analytics set up. You know what's happening on your site—which pages people visit, where they come from, and where they drop off. But here's the catch: analytics only tell you what. They can't tell you why.
A high bounce rate on your checkout page is a massive red flag, but that number alone doesn't explain the problem. Is it sticker shock from an unexpected shipping cost? Is a promo code field broken? To get to the bottom of it, you have to go deeper than quantitative data and start digging into the actual user experience.
High conversion rates aren't an accident. They’re the result of a smooth, frustration-free journey. Your job is to hunt down and eliminate every single point of friction—those annoying, confusing, or broken elements that make visitors throw their hands up and leave. These issues are often invisible in a standard analytics report but become painfully obvious once you start watching how real people navigate your site.
Uncovering Hidden Roadblocks with User Behavior Tools
To find these friction points, you need tools that let you see your website through your users' eyes. This is where qualitative analysis comes in, and your best friends for the job are heatmaps and session recordings. Honestly, they are gold mines for understanding user intent and frustration.
A heatmap gives you a visual summary of where users click, how far they scroll, and where their mouse hovers. You might discover people are repeatedly clicking on an image or a line of text that isn't actually a link—a classic sign of a confusing interface. We call these "rage clicks," and they're a direct signal that you've frustrated a user.
Session recordings take it a step further by providing video-like playbacks of individual user visits. Imagine watching a visitor try to use your site search, only to get zero relevant results. You can see them struggle in real time, rephrasing their query again and again before finally giving up and leaving. These recordings offer undeniable proof of exactly what needs to be fixed.
The most powerful insights often come from witnessing a single user struggle. Watching someone abandon their cart after failing to apply a discount code is more impactful than seeing a 5% drop-off rate on a chart.
From Observation to Actionable Hypothesis
Gathering these insights is just the first step. The real magic happens when you translate those observations into testable ideas for improvement. What you learn from heatmaps and recordings becomes the foundation for smart, targeted changes that are far more likely to boost conversions than just throwing random ideas at the wall.
Here’s how you can turn what you see into something you can act on:
-
Observation: Heatmaps show that most users aren't scrolling far enough to even see your main call-to-action (CTA) button on a key landing page.
- Hypothesis: Moving the CTA "above the fold" or adding a second one higher up the page will increase clicks and generate more conversions.
-
Observation: Session recordings reveal visitors repeatedly hesitating on the shipping information page during checkout. They look stuck.
- Hypothesis: Adding a clear, upfront "Estimated Shipping" calculator or showing shipping costs earlier in the process will reduce cart abandonment.
-
Observation: You notice users are rage-clicking a "Features" headline that looks like a button but isn't clickable.
- Hypothesis: Redesigning the headline to look less like a button, or simply making it a clickable link to the features section, will reduce confusion and improve the experience.
This cycle of observing, hypothesizing, and then testing is the heart and soul of effective CRO. For businesses that want to get serious about this, exploring professional conversion rate optimization services can provide the expertise and tools to systematically find and fix these critical friction points. By focusing on the why behind your users' actions, you can start making meaningful improvements that actually move the needle.
Writing Copy That Persuades and Sells

Think of the words on your website as your best salesperson—one who works 24/7. The right words can build a powerful case that gets people to act. The wrong ones? They just create confusion and send potential customers running for the hills.
When it comes to improving your website’s conversion rates, powerful, persuasive copy isn't just a nice-to-have. It’s a core component that can turn passive visitors into paying customers.
Effective copywriting isn't about using big words or trying to be clever. It’s about being incredibly clear, showing empathy, and proving you understand your visitor’s problem—and that you have the perfect solution. Your headlines need to grab them by the collar, your value propositions must be impossible to misunderstand, and your product descriptions should feel like they were written specifically for them.
Every word on the page should guide the visitor toward a single goal: conversion. This means you have to stop listing features and start selling the real-world benefits. How will your product make their life easier? How will your service help them succeed? That's the story you need to tell.
Crafting a Clear and Compelling Value Proposition
Your value proposition is the promise you make to your customer. It’s arguably the most important snippet of copy on your entire site, and it needs to be front and center on your homepage.
It has one job: to instantly answer the question, "Why should I buy from you and not your competitor?"
A killer value proposition is:
- Specific: It clearly spells out the benefits your customers will actually get.
- Problem-focused: It shows you’ve done your homework and understand their pain points.
- Unique: It highlights what makes you the obvious choice over everyone else.
For instance, a generic headline like "Innovative Software Solutions" is forgettable. But something like, "Save 10 Hours a Week on Admin Tasks with Our Automated Invoicing Software"—now that sells a specific, highly desirable outcome.
Building Trust and Urgency with Social Proof
People need to trust you before they’ll buy from you. And let's be honest, your own words can only go so far. This is where social proof becomes your secret weapon. It’s third-party validation that you actually deliver on your promises.
The modern customer is skeptical. They've heard it all before. Authentic social proof cuts through the noise and provides credible evidence that you're the real deal, making it a vital component for improving website conversion rates.
To really ramp up the persuasive power of your copy, you need to weave in authentic social proof. This is where things like effective website testimonials come into play. Displaying real reviews from happy customers, showcasing logos of clients people recognize, or adding security seals from trusted payment providers can dramatically lower a visitor's anxiety and friction.
This proof works best when it's specific and relatable. A testimonial saying, "This software increased our lead generation by 45% in three months," is infinitely more powerful than one that just says, "Great product!"
Place these trust signals near your calls to action. By doing this, you're reassuring visitors at the exact moment they’re on the fence, making the decision to convert feel that much safer.
Building a Strategic A/B Testing Program
Once you've spotted those friction points and polished your copy, the next step isn't to just flip a switch and push everything live. The businesses that truly nail conversion rates don't rely on guesswork; they use data to guide their decisions. This is where a structured A/B testing program becomes your secret weapon, creating a powerful cycle of testing, learning, and improving.
At its core, A/B testing (or split testing) is a straightforward method to compare two versions of a webpage to see which one gets better results. You show the original version—the "control"—to one chunk of your audience, and a new version—the "variation"—to another. By tracking which one drives more conversions, you can make changes based on what your users actually do, not just what you think they'll do.
From Strong Hypothesis to Confident Decision
Every good A/B test starts with a solid hypothesis. This isn't a random shot in the dark; it's an educated guess based on the research you've already done. A strong hypothesis is your proposed solution to a specific problem you've uncovered.
For example, maybe your session recordings show people hesitating right before the final checkout button. A weak hypothesis would be: "Let's test a green button." A strong hypothesis would be: "Changing the CTA button text from 'Complete Order' to 'Secure My Purchase & Get Instant Access' will increase checkout completions by creating a sense of security and immediacy."
See the difference? The second one is specific, measurable, and tied directly to an observed user behavior. You're not just fiddling with design elements; you're testing a psychological trigger. That's what separates a real testing strategy from just messing around with your website.
Of course, you also have to consider where your traffic is coming from. Not all visitors are created equal. Direct traffic, for example, converts at around 3.3% because those visitors usually know your brand already. In contrast, paid search traffic converts closer to 1.5%, and organic search sits around 2.3%. Knowing these average website conversion rate benchmarks helps you set realistic goals for your tests.
What Should You Be Testing?
While the possibilities are nearly endless, some changes pack a much bigger punch than others. You want to focus your energy on tests that have the potential for the biggest impact.
Here are some of the heavy hitters to consider for your A/B tests:
- Headlines and Value Propositions: Does a benefit-focused headline ("Get Flawless Skin in 30 Days") beat a feature-focused one ("Our Serum Contains 2% Hyaluronic Acid")?
- Call-to-Action (CTA) Buttons: Test everything—the text, color, size, and placement. Sometimes a simple change from "Sign Up" to "Get Started for Free" can make a world of difference.
- Page Layout and Design: Could a simpler, single-column layout on your product pages reduce distractions and boost add-to-cart clicks?
- Images and Videos: Does a video of your product in action convert better than a static studio photo? Does showing real customers get more engagement?
- Forms: This is a huge one. Test the number of fields, the layout, and even the labels to cut down on form abandonment.
Tools like Google Optimize or Optimizely are built for this. They make it surprisingly easy to set up and manage these experiments.
A good testing platform will give you a clear dashboard like the one above, showing you exactly how your experiment is running and which version is pulling ahead.
The whole point is to reach statistical significance. This is a fancy way of saying you have enough data to be confident your results aren't just a fluke. Most tools aim for a 95% confidence level before calling a winner. Once you hit that mark, you can roll out the winning version to 100% of your audience with confidence and start planning your next test.
Optimizing for High-Converting Traffic Channels

Getting traffic to your website is only half the job. If you really want to move the needle on conversions, you have to accept a simple truth: not all visitors are the same. A customer who clicks through from a targeted email campaign is in a completely different headspace than someone who just stumbled across your site from a random social media ad.
When you figure out where your best customers are coming from, you can start making smarter decisions. It allows you to pour your marketing budget into what’s working and fine-tune your website experience for the people who are most likely to buy. It's time to stop treating everyone the same and start personalizing their journey from the moment they land on your page.
Aligning Your Message with Visitor Intent
I see it all the time—it’s probably the single biggest mistake businesses make. They send all their hard-won traffic to a generic homepage. That’s a recipe for a high bounce rate.
Think about it. If someone clicks an ad for "men's running shoes," they should never, ever land on a page that also features women's apparel and kids' sneakers. That immediate disconnect between their expectation and your reality is a massive conversion killer.
The fix for this is a concept called message matching. It's the art and science of making sure your landing page is a perfect reflection of the ad, link, or post the visitor just came from. You need to mirror the language, the offer, and the visual cues.
This is especially critical for search traffic. When you get the message match right, you instantly reassure visitors they've landed in the right spot. It builds immediate trust and gives them a reason to stick around. We get into the nitty-gritty of this in our guide on data-driven https://upnorthmedia.co/services/seo-marketing, which shows how to sync your content perfectly with what people are searching for.
Identifying Your Most Valuable Channels
Different marketing channels just naturally perform differently. It all comes down to the user's intent. While you'll often hear that average eCommerce conversion rates hover somewhere between 2% and 4%, the real story is in where that traffic originates.
To get a clearer picture, let's look at how different channels stack up.
Average Conversion Rates by Marketing Channel
A comparative look at conversion rates from top marketing channels to guide your optimization strategy.
| Marketing Channel | Average Conversion Rate | Key Optimization Tactic |
|---|---|---|
| Email Marketing | 10.3% | Segment lists and personalize offers based on past behavior. |
| Referral Traffic | 5.5% | Build an affiliate program with trusted brand advocates. |
| Organic Search | 4.7% | Create targeted landing pages that match high-intent keywords. |
| Paid Search (PPC) | 3.2% | Use ad extensions and ensure strong message match with landing pages. |
| Direct Traffic | 2.9% | Foster brand loyalty through excellent service and memorable branding. |
| Social Media | 1.9% | Run highly targeted ad campaigns to specific demographic/interest groups. |
As you can see, not all channels are created equal. The data clearly shows that channels with higher user intent, like email and organic search, consistently outperform broader channels like social media.
Email marketing, for instance, is an absolute powerhouse. Why? Because your subscribers already know you and trust you. They've opted-in to hear from you, making them incredibly receptive to your offers. It’s not unusual for a well-run email campaign to hit a 10.3% conversion rate and generate a massive ROI.
By segmenting your email lists and tailoring offers, you're not just blasting out a generic message; you're speaking directly to what your audience wants. A simple "back-in-stock" notification can easily convert at over 7% because it solves an immediate, specific problem for the customer.
Once you start comparing your channels, you can allocate your resources much more strategically. If organic search is bringing in high-value customers who stick around, it's a clear signal to invest more in your content and technical SEO. On the flip side, if a social media platform is sending you tons of traffic that never converts, it might be time to pull back and rethink your approach there.
This kind of focused strategy ensures your marketing dollars are spent on activities that don’t just bring in clicks, but actually grow your business with loyal customers. For a more comprehensive look at tactics, check out these proven ways to improve website conversions.
Frequently Asked Questions About CRO
Jumping into conversion rate optimization always kicks up a few questions. As you start making changes and watching the data, it's completely normal to wonder if you're even on the right track. Let's tackle some of the most common questions we hear from clients to give you a bit more confidence on your CRO journey.
What Is a Good Conversion Rate?
This is, without a doubt, the question I get asked most often. And the answer is always the same: it depends.
A "good" conversion rate is completely relative to your industry, your specific business model, and even where your traffic is coming from. For instance, an e-commerce store might hover between 2% to 4%, and they'd be pretty happy. But a B2B SaaS company might see a 1% trial signup rate as a massive win. They're just different games.
Instead of getting hung up on some universal magic number, you should focus on your own baseline and aim for steady, incremental gains. The real goal is to consistently beat your own records. You can dig deeper into this in our full guide to building effective conversion rate optimization strategies.
The only benchmark that truly matters is your own past performance. If you converted at 1.5% last quarter, pushing that to 1.8% this quarter is a tangible, valuable victory. Continuous improvement is the name of the game.
How Long Should I Run an A/B Test?
Timing is everything with A/B tests. One of the biggest mistakes people make is calling a test the second one variation pulls ahead. This is a recipe for false positives, where you're just measuring random luck, not genuine user preference.
To get data you can actually trust, you need to let a test run for at least one full business cycle. For most businesses, that means one to two weeks. This simple rule helps smooth out the natural highs and lows in traffic and user behavior that happen on different days of the week (think weekend shoppers vs. weekday researchers).
You also need a big enough sample size to make a call. Most A/B testing tools will tell you when you’ve hit 95% statistical significance. That's the industry standard, and it's your green light to make a decision. Don't end the test until you hit that number.
Where Should I Start My Optimization Efforts?
When you have a whole list of potential fixes, it’s easy to feel a bit paralyzed. The best way I've found to cut through the noise is to prioritize based on two simple factors: potential impact and ease of implementation.
Fire up your analytics and find your high-traffic, low-converting pages. These are your golden opportunities. Even a tiny lift on these pages can have a huge impact on your bottom line.
Here’s a simple framework to get you started:
- Homepage: This is your digital front door. Your first impression. The main job here is to make your value proposition crystal clear.
- Product/Service Pages: These are your digital salespeople. You need to nail the copy, get compelling images, and show off your social proof.
- Checkout/Form Pages: This is the final step. The last hurdle. Any friction here is costing you money, period. Simplify everything and get rid of any and all distractions.
Start with the low-hanging fruit—changes that are easy to make on pages that have a direct impact on revenue. Fixing a broken button in your checkout process will almost always deliver a bigger, faster return than a complete redesign of a blog post nobody reads.