Measuring your digital marketing performance isn't just about tracking numbers. It's about connecting every single metric you watch directly back to a core business objective. This is how you translate clicks, views, and leads into tangible proof that marketing is driving revenue and growth. It's the difference between being busy and being effective.
Aligning Marketing Metrics With Business Goals
It’s easy to get caught up chasing vanity metrics. Think social media likes or raw page views. These numbers might look impressive on the surface, but they rarely tell the real story of marketing's contribution to the bottom line.
Real performance measurement starts long before you open a dashboard. It begins with a clear, strategic foundation that ties every marketing action back to a high-level business goal. Without this alignment, you’re just flying blind, unable to justify your budget or prove your value.
The global digital marketing market is projected to hit $786.2 billion by 2026. That massive scale only intensifies the pressure to show a clear return on every dollar spent. Precise measurement isn't a "nice-to-have" anymore; it's critical.
From Business Goals to Actionable KPIs
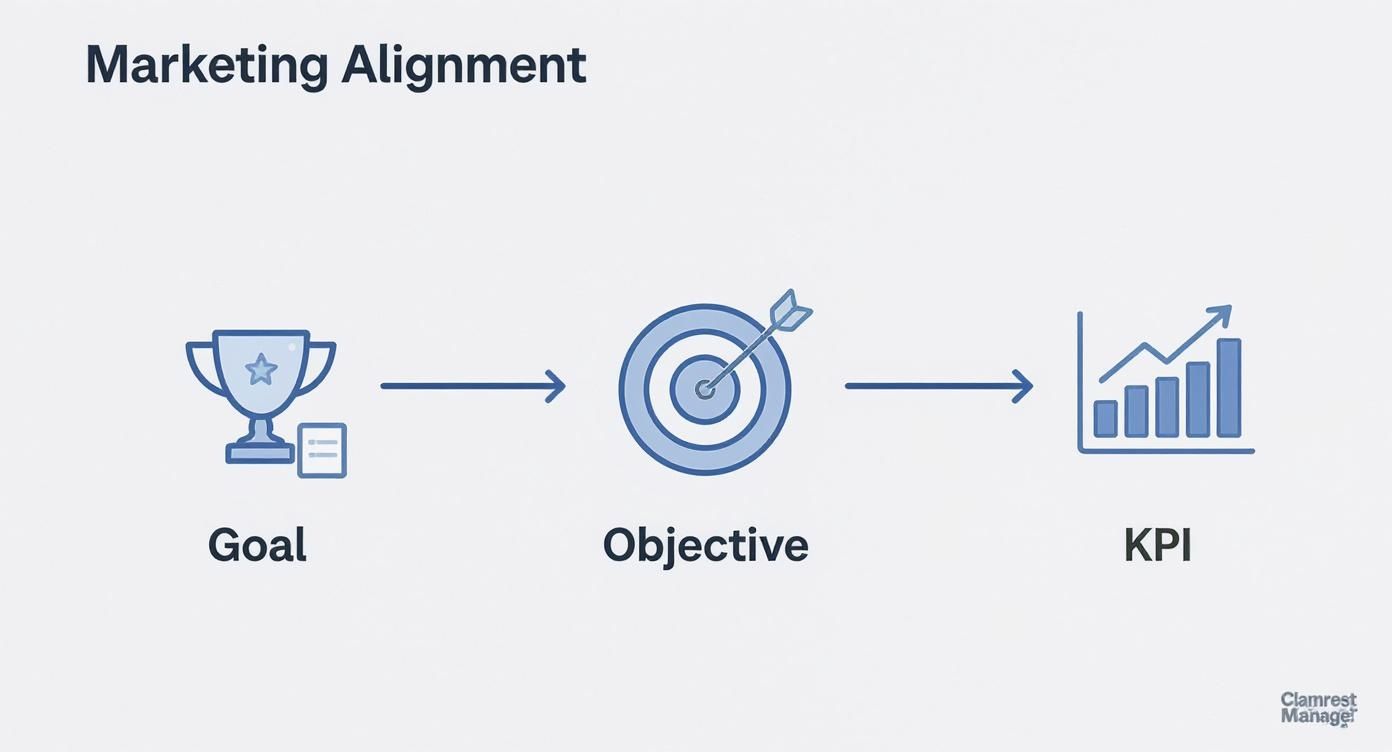
The trick is to create a logical chain that connects the boardroom to your campaign reports. I've always found the GOST model (Goals, Objectives, Strategies, and Tactics) to be a super effective way to do this. It forces you to break down broad ambitions into measurable, actionable steps.
Here’s how it works:
- Goal: This is the big-picture business ambition. Think high-level, like "Increase annual revenue by 20%."
- Objective: This is a specific, measurable marketing outcome that directly supports the goal. For example, "Generate 500 new Marketing Qualified Leads (MQLs) this quarter."
- Strategy: This is your general approach to hitting that objective. Something like, "Use targeted content marketing to attract mid-funnel prospects."
- Tactic: These are the specific actions you'll execute. For instance, "Publish two in-depth blog posts and host one webinar per month."
This cascade ensures every single tactic has a purpose. The success of your webinar isn't just measured by how many people showed up; it's measured by how many of those attendees became MQLs, which directly contributes to the core business goal.
A metric tells you what happened. A Key Performance Indicator (KPI) tells you if what happened actually matters to the business. The difference is purpose.
The table below breaks down how you can connect high-level business goals to specific marketing KPIs for different types of businesses. It's a simple framework, but it's incredibly powerful for keeping everyone focused on what truly moves the needle.
Connecting Business Goals to Marketing KPIs
| Business Goal | Marketing Objective | Primary KPI | Secondary Metrics |
|---|---|---|---|
| Increase Profitability | Achieve a 4:1 Return on Ad Spend (ROAS) | ROAS | Average Order Value (AOV), Conversion Rate |
| Grow Market Share | Increase organic search visibility by 30% | Organic Traffic & Keyword Rankings | Click-Through Rate (CTR), Branded Search Volume |
| Improve Customer Lifetime Value (CLV) | Boost customer retention rate by 15% | Customer Churn Rate | Repeat Purchase Rate, Net Promoter Score (NPS) |
| Lower Acquisition Costs | Reduce Customer Acquisition Cost (CAC) to $1,500 | CAC | Cost Per Lead (CPL), Lead-to-MQL Conversion Rate |
This kind of clear, logical connection is what helps you prove the value of your work. It stops the "what are we even paying for?" conversations before they ever start.
Real-World Examples of Alignment
Let's make this more concrete.
An e-commerce store with a goal to increase profitability might set a marketing objective to "Achieve a 4:1 Return on Ad Spend (ROAS)." Their primary KPI is ROAS, supported by secondary metrics like Average Order Value (AOV) and Cart Abandonment Rate. Every ad campaign is judged against that 4:1 benchmark.
Or, take a B2B SaaS company aiming to grow its enterprise client base. Their objective could be to "Lower Customer Acquisition Cost (CAC) to $1,500." The main KPI is CAC, but they'll also track supporting metrics like the lead-to-MQL conversion rate and the average sales cycle length to see where they can find efficiencies.
Ultimately, this alignment is what allows you to speak the language of business leaders. To truly show the impact of your marketing, knowing how to measure marketing ROI and prove your value is non-negotiable. It’s what bridges the gap between your daily activities and the company's financial outcomes.
For a more detailed walkthrough, check out our guide on https://upnorthmedia.co/blog/how-to-calculate-marketing-roi.
Building Your Modern Measurement Tech Stack
Once you’ve nailed down your strategy and KPIs, it's time to get your hands dirty with the tech. This is where we build the engine that actually captures all the data you need. A solid measurement stack is what takes you from making educated guesses to making data-driven decisions.
Let's be clear: this isn't just about slapping a Google Analytics tag on your site. It's about building a connected system that gives you a complete, trustworthy picture of the customer journey. Getting this right from the start saves you from the massive headache of bad data down the road—something that can completely derail your marketing.
Getting Google Analytics 4 Set Up Right
Google Analytics 4 (GA4) is the central nervous system for most marketing stacks today. Its event-based model is incredibly powerful, but it’s only as good as your setup. Out of the box, GA4 tracks some basic stuff, but the real magic comes from telling it what you care about.
You have to manually define the actions that actually matter to your business. This means looking past simple page views and setting up custom events for the moments that count.
- For an e-commerce shop: You’ll want to track
add_to_cart,begin_checkout, andpurchaseevents. Make sure to include details like product ID and value. - For a B2B startup: Configure events for things like
demo_request,pricing_page_view, andwhitepaper_download. - For a publisher: Set up events that track
newsletter_signup,scroll_depth(to see how much of an article people actually read), andvideo_play.
The final, crucial step is flagging these key events as official conversions inside the GA4 platform. This tells Google which actions are directly tied to your business goals, which is what makes your performance reports truly meaningful.
This simple flow—from a high-level business goal down to a specific KPI—shows exactly why getting the technical details right is non-negotiable.
The Inevitable Shift to Server-Side Tagging
With privacy rules getting stricter and browsers cracking down with things like ITP (Intelligent Tracking Prevention), the old way of tracking (client-side) is becoming less and less reliable. Ad blockers and cookie limitations can cause huge gaps in your data—I've seen it cause losses of up to 20-30%.
This is where server-side tagging comes into play. Instead of sending data from a user's browser straight to Google or Facebook, you send it to your own server first. From there, your server securely passes that data along to your analytics and ad partners.
Server-side tagging isn't just a clever workaround. It's a fundamental shift toward better data ownership, security, and accuracy. You get to control exactly what data you share, who you share it with, and how it’s formatted.
Not only does this make your data more accurate, but it can also speed up your website since you’re running fewer heavy scripts in the browser. It’s a bit more technical to set up, sure, but it's quickly becoming essential for anyone serious about measurement.
UTM Discipline and Connecting Your CRM
Your analytics platform tells you what happened on your site, but it often struggles to tell you why. That’s where a disciplined UTM strategy and a good CRM integration come in to create a powerful, closed-loop system.
UTM (Urchin Tracking Module) parameters are just simple tags you add to the end of your URLs to see where your traffic is coming from. Consistency here is everything. Every single link you put out there—in ads, emails, social posts—needs to be properly tagged.
A good UTM structure might look something like this:
utm_source=googleutm_medium=cpcutm_campaign=q4-black-friday-saleutm_content=video-ad-version-a
This level of detail lets you see precisely which campaigns, and even which specific ads, are driving results.
Finally, integrating your analytics with your Customer Relationship Management (CRM) platform—think HubSpot or Salesforce—is what closes the loop. This connection pushes lead data from your website into your CRM. More importantly, it can send sales data back into your analytics tools.
This two-way street connects your marketing spend directly to actual, closed-won revenue. You can finally answer the million-dollar question: "How much revenue did that specific Google Ads campaign really generate?" That full-funnel view is the holy grail of marketing measurement.
Mastering Attribution and Channel Performance
Alright, let's talk about attribution. This is where a lot of marketers get tripped up, and for good reason—it’s the messy, complicated process of figuring out which touchpoints get credit for a conversion. If you don't get this right, you're basically flying blind with your budget.
Most platforms default to Last-Click Attribution. This model is simple, but it’s also dangerously misleading. It gives 100% of the credit to the final click a customer made before buying.
Think about it like this: that’s like giving the cashier all the credit for a big sale, completely ignoring the clever window display that caught the customer's eye, the TV ad that got them in the door, and the salesperson who answered all their questions. Last-click overvalues channels that are good at closing the deal (like branded search) and completely ignores the ones that build awareness (like social media or display ads).
Moving Beyond the Last Click
To get a true sense of what’s working, you have to look at models that spread the credit across the whole customer journey. Each one tells a different story, so the right choice really depends on your sales cycle and business model.
-
Linear Attribution: This is the great equalizer. It splits credit evenly across every single touchpoint. If a customer saw a Facebook ad, clicked an email, then did a brand search, each gets 33.3% of the credit.
-
Position-Based (U-Shaped) Attribution: A smart hybrid model. It gives 40% of the credit to the first touchpoint (the introduction) and 40% to the last one (the closer). The remaining 20% is split among all the interactions in between.
-
Time Decay Attribution: This one values recency. The touchpoints closest to the conversion get the most credit. An interaction from an hour ago is worth more than one from last week.
The goal isn't to find one "perfect" attribution model. The real insight comes from comparing them. Put your last-click report next to a linear report and see which channels you’ve been undervaluing.
For a B2B company with a six-month sales cycle, a Linear model is gold. It shows the sustained effort needed to nurture that lead. But a fast-moving e-commerce brand? They might find Position-Based or Time Decay more useful for spotting what sparks initial interest and what seals the deal.
If you want to go deeper on this, our guide on what is marketing attribution is a great next step.
The Power of Data-Driven Attribution
The most sophisticated option, which you’ll find in platforms like Google Analytics 4, is Data-Driven Attribution (DDA). This isn't based on a fixed rule. Instead, it uses machine learning to analyze all your conversion paths—and just as importantly, your non-conversion paths—to figure out how much credit each touchpoint truly deserves.
DDA is the closest you can get to understanding the real, incremental impact of each channel because it’s tailored to your specific customer behavior.
Analyzing Channel-Specific Performance
Once you’re looking beyond the last click, you can analyze channel performance with so much more context. You start to see how everything works together.
| Channel | Core Metrics | Contextual Question |
|---|---|---|
| SEO | Organic Traffic, Keyword Rankings, Backlinks | Is our organic traffic just growing, or is it assisting conversions that happen later? |
| PPC | Cost Per Acquisition (CPA), Return on Ad Spend (ROAS) | Which campaigns are introducing new customers (first-click) vs. closing deals (last-click)? |
| Social Media | Engagement Rate, Assisted Conversions | Are our social efforts driving top-of-funnel awareness that leads to sales through other channels? |
Looking at these metrics through different attribution lenses tells a much richer story. You might discover that your blog content, which has a terrible last-click conversion value, is actually the first touchpoint for most of your highest-value customers. That’s an insight that stops you from cutting the budget on a channel that’s quietly fueling your growth.
For a deeper dive into evaluating the impact of your campaigns and understanding true advertising effectiveness across various channels, explore insights on Mastering Advertising Effectiveness Measurement. This kind of analysis is what separates good budget decisions from bad ones.
Creating Dashboards That Drive Action
All the tracking and data you've carefully put together is only as good as the decisions it helps you make. A spreadsheet full of raw numbers isn't insight—it's just noise. A well-designed dashboard, on the other hand, tells a clear story that actually gets people to do something. The real goal is to get from data collection to data visualization that drives real improvement.
This is where tools like Google Looker Studio or Tableau become your best friends. They can turn messy datasets into clean, visual reports. But the secret isn't just the tool; it's how you use it to get the right information in front of the right person.
Tailoring Dashboards to Your Audience
One of the biggest mistakes I see is a one-size-fits-all approach to reporting. Your CEO and your PPC manager care about completely different things, and their dashboards need to reflect that. If you try to show everyone everything at once, you just create confusion and nobody takes action.
An effective dashboard filters the signal from the noise based on who's looking at it.
- For the CEO or Leadership Team: They need the 10,000-foot view. Their dashboard should be a high-level, executive summary focused on the bottom line. Think big-picture KPIs like Customer Acquisition Cost (CAC), Marketing-Sourced Revenue, and overall Return on Ad Spend (ROAS).
- For the Marketing Manager: This person needs a more tactical view connecting the channels to the results. Their dashboard should show channel performance, lead volume, and MQL-to-SQL conversion rates. It’s the bridge between daily activity and the big-picture goals.
- For the Channel Specialist (e.g., SEO or PPC Manager): Here’s where you get into the weeds. A PPC specialist’s dashboard needs campaign-level data—things like Cost Per Click (CPC), Click-Through Rate (CTR), Quality Score, and conversion rates by specific ad group.
A great dashboard doesn't just show data; it answers specific business questions. For a CEO, the question is, "Is marketing making us money?" For a specialist, it's, "Which ad creative is tanking this week?"
Designing for Clarity and Impact
Once you know who you're building for, the design is all about visual storytelling. The layout should guide the viewer's eye from the most critical info down to the supporting details. I always start with a summary of the most important KPIs right at the top, then use charts and tables to break down performance by channel, campaign, or time period.
Modern performance measurement relies on comprehensive dashboards that pull in metrics from multiple channels. You need website indicators like total traffic and conversion rates to benchmark user behavior, alongside paid campaign KPIs—like Cost Per Acquisition (CPA) and keyword ranking—to fine-tune your strategy. You can learn more about the top metrics that matter for marketing ROI and how they all come together in a useful dashboard.
Establishing a Practical Reporting Rhythm
A dashboard is a living tool, not a one-time report. You have to build a consistent rhythm for reviewing performance to create a culture of continuous improvement and keep everyone on the same page. Getting lost in the data every single day is a waste of time, so you need a cadence that actually makes sense.
Here’s a sample reporting schedule that works really well for most of the teams I've worked with.
Sample Marketing Reporting Cadence
This schedule breaks down what to look at and when, ensuring that reviews are focused and productive.
| Frequency | Key Metrics to Review | Purpose of Review | Audience |
|---|---|---|---|
| Daily | Ad Spend, Traffic Spikes/Dips, Conversion Tracking | Quick health check for major anomalies or broken tracking. | Channel Specialist |
| Weekly | Campaign Performance, CTR, CPC, Lead Volume, Content Engagement | Tactical review to optimize campaigns and reallocate budgets. | Marketing Manager, Specialists |
| Monthly | ROAS, CPA, MQLs, Channel ROI, Progress vs. Goals | Strategic review of overall performance against monthly targets. | Marketing Manager, Leadership |
This structure prevents you from getting bogged down in daily noise while still catching problems quickly.
A structured approach ensures you’re always measuring with purpose. You're not just looking at numbers—you're turning insights into timely, effective action.
Turning Measurement into Optimization

So, your dashboards are built and data is finally flowing in. It’s tempting to sit back and admire the pretty charts, but this isn't the finish line. This is the starting line.
Effective measurement is never about just collecting numbers. It’s about turning those numbers into real, tangible business growth. This is the part where we stop looking at data and start using it.
To do this right, you can't just guess or throw ideas at the wall. You need a repeatable process, a framework that takes you from spotting a problem in your data to rolling out a proven solution. It’s what separates data-driven decisions from random shots in the dark.
A Framework for Continuous Improvement
One of the most powerful (and simple) optimization frameworks I've used follows a clear cycle: Analyze, Hypothesize, Test, and Implement. It’s a structured way to make sure your marketing gets better over time, one smart decision at a time.
- Analyze: Dive into your data with a question. Don’t just skim the surface; look for patterns, weird drop-offs, or unexpected bright spots. Where is the story?
- Hypothesize: Based on what you found, make an educated guess. A good hypothesis isn't vague; it’s a clear "If we change X, then Y will happen because of Z" statement.
- Test: Set up a clean experiment, like an A/B test, to see if your hypothesis holds water. This is where you let your audience vote with their clicks.
- Implement: Once you have a clear winner, roll out the change confidently and watch how it impacts your main KPIs over the long haul.
This isn't a one-and-done deal. It’s a loop. The small, incremental wins you get from this cycle compound over time, leading to massive improvements in your overall performance.
Putting the Framework into Action
Let's make this real. Imagine an e-commerce store is digging into their GA4 funnel report.
1. The Analysis They spot a huge problem right away: a massive 75% drop-off rate between the "begin checkout" and "purchase" events. Think about that. For every four people who start to check out, three of them are bailing. That's a serious leak in the bucket.
2. The Hypothesis The team walks through the checkout flow themselves and finds a potential culprit: the shipping cost is a surprise, revealed only on the final step. This leads to their hypothesis: "We believe showing unexpected shipping fees late in the checkout process causes sticker shock and leads to high cart abandonment." They predict that if they show a shipping cost estimate earlier, they'll reduce that friction and see more completed purchases.
3. The Test They set up a straightforward A/B test.
- Control (Variation A): The original checkout flow where shipping costs appear at the very end.
- Challenger (Variation B): A modified flow that adds a shipping calculator to the cart page, before the user even starts checking out.
They let the test run until it reaches statistical significance. This is critical—it ensures the results aren't just a fluke.
A word of caution from experience: never, ever stop a test early just because one version is pulling ahead. You need a large enough sample size and a high confidence level (we always aim for 95% or higher) to declare a real winner. Acting on flimsy data is just as bad as guessing.
4. The Implementation After two weeks, the results are in and they're clear. Variation B—the one showing shipping costs early—drove a 15% lift in the checkout completion rate. The result was statistically significant, proving their hypothesis right. The team confidently rolls out the new cart page design to 100% of their traffic. Building on these small, validated wins is the core of smart conversion rate optimization strategies.
Common Pitfalls to Avoid in Optimization
This process sounds simple enough, but a few common mistakes can completely derail your efforts. Just being aware of them is half the battle.
- Mistaking Correlation for Causation: This is a classic. Just because two things happen at the same time doesn't mean one caused the other. Maybe your sales spike in the summer right as your social media engagement goes up. Does that mean higher engagement caused more sales? Probably not. A seasonal trend is a much more likely explanation. The only way to prove causation is with a controlled test.
- Ignoring Statistical Significance: I mentioned it before, but it's worth repeating. If you act on test results that aren't statistically significant, you might as well be flipping a coin. You could implement a change that does nothing, or worse, actually hurts your performance.
- Focusing on the Wrong Metrics: It feels good to see "time on page" go up, but is that your actual goal? Optimizing for vanity metrics is a waste of time if they don't tie back to a core business KPI like revenue or qualified leads. Always keep your eye on the prize.
Answering Your Toughest Marketing Measurement Questions
Even with a perfect framework on paper, the real world throws curveballs. Let's tackle some of the questions I hear all the time from marketers who are trying to make this work, especially when dealing with tight budgets or stakeholders who just don't get it.
"How Can I Possibly Measure Performance With No Budget?"
When you're running on fumes, you have to be ruthless with your focus. Forget tracking everything. Your best friends are the free tools you already have: Google Analytics 4 and Google Search Console.
Instead of a dozen different goals, pick just one or two that are the closest you can get to revenue. Think newsletter sign-ups or "contact us" form fills. These are your lifeline.
Track the conversion rates for those goals obsessively. This is where a disciplined UTM tracking strategy becomes non-negotiable. Tag every single link you put out there—social media, emails, guest posts, you name it. This is the only way you’ll know which of your free channels are actually pulling their weight and driving traffic that converts.
You’ll want to prioritize the organic metrics that signal you're building something sustainable:
- Organic traffic growth: Are more people finding you through search this month than last month?
- Keyword rankings for high-intent terms: Are you showing up for searches that scream "I'm ready to buy"?
- Engagement rates on your main social channel: Is your content actually connecting with the right people?
The key here is discipline. Zero in on the few KPIs that you can draw a straight line from to business growth. Everything else is just noise.
"What’s the Real Difference Between a KPI and a Metric?"
Getting this right is one of the most important things you can do. It's a classic point of confusion, but the distinction is actually pretty simple.
Think of it this way: a metric is just a number. It's a raw data point. Page views, clicks, likes, time on page—these are all metrics. They tell you what happened, but not much else.
A Key Performance Indicator (KPI), on the other hand, is a metric you've hand-picked because it measures your progress toward a critical business goal. A KPI tells you if what happened actually matters.
While every KPI is a metric, not every metric is a KPI. The difference is purpose and strategic importance.
For example, "page views" is a metric. But "conversion rate on the pricing page" is a KPI. Why? Because it directly tells you how well you’re turning curious visitors into potential customers, which is obviously tied to a revenue goal. Your KPIs are the handful of metrics you’d be confident showing the CEO to prove marketing is actually working.
"How Often Should I Be Changing My Marketing KPIs?"
Your core, top-level KPIs should almost never change. Seriously. These are the big ones tied directly to the fundamental health of the business, and they should stay put as long as your business objectives don't change. We're talking about your North Stars, like Customer Acquisition Cost (CAC), overall Return on Ad Spend (ROAS), and Marketing-Sourced Revenue.
What should change are the supporting metrics you focus on to move those big KPIs. For one quarter, you might be obsessed with improving your email open rate (a supporting metric) because you know it's the best lever to pull for your lead generation KPI. Once you’ve dialed that in, maybe your focus shifts to improving landing page conversion rates.
It’s a hierarchy. The main KPIs provide long-term strategic direction, while the tactical metrics you're tracking and optimizing are the levers you pull week to week to stay on course. This gives you both stability and the flexibility to adapt.
At Up North Media, we specialize in turning all this data into a clear roadmap for growth. If you're ready to stop just tracking numbers and start making strategic, revenue-driven decisions, we should talk. Schedule a free consultation with us today.