You can’t improve what you don’t measure. In marketing, that means evaluating your efforts against a clear set of goals using specific metrics. It's the only way to know if your budget is being spent wisely and if your activities are actually moving the needle on what matters most: revenue and customer growth.
Why You Must Measure Marketing Campaign Effectiveness
Are you pumping money into campaigns without knowing what's really working? So many businesses fall into this trap. They run campaigns that feel successful but have zero hard data to back it up. That gap between perception and reality is where budgets vanish and opportunities are lost.
Simply put, precise measurement is the difference between guessing and growing.
Moving Beyond Vanity Metrics
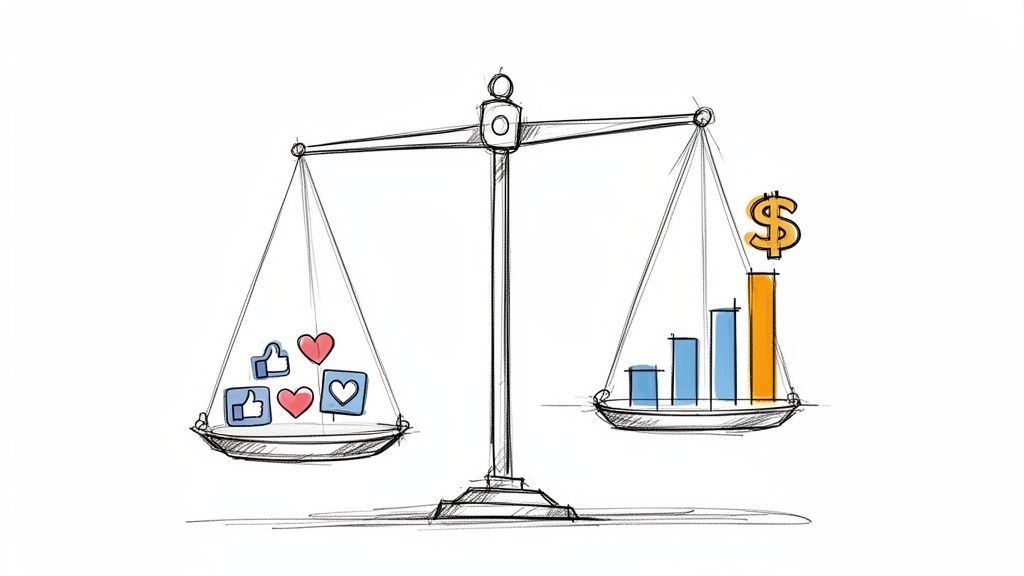
The problem usually starts with chasing the wrong numbers. Things like social media likes, page views, and impressions are easy to track, but they don't tell you the full story. They're signs of activity, not outcomes.
Think about it: a post with 10,000 likes might not generate a single qualified lead. Meanwhile, a niche blog post that only gets a few hundred views could be attracting your most valuable customers. Effective measurement is all about shifting your focus from these vanity metrics to the data that directly impacts your bottom line. It’s about drawing a straight line from every marketing action to a tangible business result.
The core purpose of measuring campaign performance is to transform marketing from a cost center into a predictable revenue driver. It's about providing clear evidence that your team's hard work generates a positive return on investment.
The Real-World Impact of Data-Driven Decisions
When you truly commit to measuring your campaigns, you unlock the ability to make smarter decisions that fuel actual growth. This isn't just a big-corporation game for companies with massive analytics teams; it's a vital practice for any business that wants to stick around.
Here’s what you can actually do with precise measurement:
- Justify Your Marketing Spend: Walk into any meeting and confidently show stakeholders exactly how their investment is paying off, backed by hard numbers like Return on Ad Spend (ROAS) and Customer Acquisition Cost (CAC).
- Optimize on the Fly: Instead of waiting for a campaign to end to find out it flopped, you can spot underperforming channels or ads early on. This lets you shift your budget to what’s actually working, right now.
- Truly Understand Your Customers: The data will tell you where your best customers are coming from, what messages they respond to, and how long it really takes to turn them from a prospect into a paying customer.
- Scale What Works: Once you identify your most profitable campaigns, you can double down with confidence and accelerate your growth.
Connecting your marketing efforts to revenue isn't just a "nice-to-have"—it's essential for survival. For a deeper dive into the strategies behind evaluating advertising impact, check out this guide on Mastering Advertising Effectiveness Measurement. This will help set the stage as we build a practical framework for turning raw data into game-changing decisions.
Defining What Success Looks Like For Your Business
Before you spend a single dollar or track a single click, you have to answer the most important question: What does winning actually look like for this campaign?
If you don't have a crystal-clear answer, you're just collecting data, not driving results. You’ll end up with a pile of numbers that don't tell you whether you succeeded or failed.
The first step is always to translate those big, ambitious company goals—like "increase annual revenue by 20%"—into something your marketing campaign can realistically achieve. That big number is your North Star, but your campaign needs a tangible, measurable target.
This means breaking it down. The goal isn't just "growth"; it's "generate 500 marketing qualified leads (MQLs) this quarter" or "boost our new product's e-commerce conversion rate by 15%." Now that's a target you can build a campaign around and measure against.
Matching Campaign Goals to Essential KPIs
Once your objective is set in stone, you need to pick the right metrics—your Key Performance Indicators (KPIs)—to measure it. This is where so many businesses go wrong. They use the same generic dashboard for every campaign, but the KPIs for a brand awareness push are completely different from those for a direct sales campaign.
Different goals demand different yardsticks. You wouldn't use a ruler to measure temperature, right? Same principle applies here.
Let's break it down:
- For Brand Awareness: Your goal is to get on people's radar, not necessarily to make an immediate sale. You're buying attention. That means you should be obsessed with metrics like Impressions, Reach, and Social Media Engagement (especially shares and comments).
- For Lead Generation: Here, it’s all about feeding your sales pipeline. The numbers that matter are your Cost Per Lead (CPL), the Conversion Rate on your landing pages, and the raw number of Marketing Qualified Leads (MQLs) you're handing over to sales.
- For E-commerce Sales: This is where the rubber meets the road. It's about turning clicks into cash, efficiently. Your go-to KPIs are Return on Ad Spend (ROAS), Conversion Rate, and Average Order Value (AOV).
The only metrics that truly matter are the ones that tell a story about your customer's journey and the campaign's bottom-line impact. If a KPI doesn't help you make a smarter decision next time, it's just noise.
To make this even clearer, this table shows how to connect your goals to the right metrics.
Matching Campaign Goals to Essential KPIs
| Campaign Goal | Primary KPI | Secondary KPIs | Example Scenario |
|---|---|---|---|
| Increase Brand Awareness | Impressions / Reach | Engagement Rate, Video Views, Website Traffic | A new coffee shop runs a local social media campaign to introduce itself to the community before its grand opening. |
| Generate New Leads | Cost Per Lead (CPL) | Conversion Rate, MQLs, Form Fills | A B2B software company runs a LinkedIn campaign promoting a downloadable whitepaper to capture contact info from potential clients. |
| Drive E-commerce Sales | Return on Ad Spend (ROAS) | Conversion Rate, Average Order Value (AOV), Cart Abandonment Rate | An online clothing store runs Google Shopping ads to sell its new summer collection directly from its website. |
| Promote a Mobile App | Cost Per Install (CPI) | App Store Ranking, Daily Active Users (DAU), In-App Purchases | A gaming startup launches a new mobile game and runs ads on Instagram Stories to encourage downloads. |
Choosing the right KPIs from the start is the difference between flying blind and having a clear dashboard guiding your every move.
How This Looks in The Real World
Let's get practical. Imagine you're an Omaha-based plumber. You don't really care about website traffic for its own sake. You care about one thing: making the phone ring with paying customers. For you, Cost Per Acquisition (CPA) is everything. You need to know exactly how many marketing dollars it takes to book one job.
Now, flip that script. A digital publisher running a popular blog has a totally different business model. They make money from ads, so their success hinges on keeping eyeballs on their pages. They're laser-focused on metrics like Average Session Duration, Pages Per Visit, and Ad Impressions Per User. The longer people stick around, the more money they make.
For anyone selling products online, one metric stands above the rest: ROAS. A solid campaign might hit a 4:1 ROAS, which means you're making $4 in revenue for every $1 you put into ads. Knowing how to calculate return on ad spend (ROAS) is non-negotiable if you want to understand if your ads are actually making you money.
Don't Confuse ROAS with ROI
It's easy to mix up ROAS and Return on Investment (ROI), but they tell you two very different things about your business. Think of ROAS as a quick temperature check on a specific ad campaign, while ROI is the full-body physical for your entire marketing effort.
Here’s a simple breakdown:
| Metric | What It Measures | Calculation Focus | Primary Use Case |
|---|---|---|---|
| ROAS | Measures the gross revenue generated for every dollar spent on advertising. | Revenue from Ad Campaign ÷ Cost of Ad Campaign | Quickly evaluating the direct performance and profitability of a specific ad campaign or channel. |
| ROI | Measures the total profit generated from the entire marketing investment, including all associated costs. | (Net Profit - Marketing Cost) ÷ Marketing Cost | Assessing the overall profitability of your marketing strategy, accounting for all expenses like software, salaries, and creative. |
ROAS is tactical. It’s perfect for making quick decisions, like whether to increase the budget on a Facebook campaign that's crushing it.
ROI is strategic. It answers the bigger question: "Is our marketing department as a whole a profitable engine for the company?" You need both. Understanding how to calculate marketing ROI gives you that complete picture of your financial success.
Building Your Data Tracking Infrastructure
To measure anything well, you need reliable data. It's the one non-negotiable. Without a solid technical backbone to capture what people are actually doing, your analysis is just a well-informed guess. Building this infrastructure isn't just for data scientists; it's the bedrock for any marketer who's serious about proving their impact.
Think of it like the plumbing in your house. If the pipes are leaky or disconnected, you can't trust what comes out of the faucet. The goal here is to create a clean, organized flow of information from every single touchpoint—your ads, emails, social posts—straight into your analytics platform.
Demystifying UTM Parameters
First things first: you have to know where your traffic is coming from. This is where Urchin Tracking Module (UTM) parameters become your best friend. They're just simple snippets of text tacked onto the end of a URL that tell tools like Google Analytics exactly how someone landed on your site.
UTMs answer the most critical questions. Did this visitor click from our monthly email newsletter or a specific Facebook ad? That level of detail is everything because it allows you to attribute sales and leads directly to the marketing effort that drove them.
A properly tagged URL looks something like this:
yourwebsite.com/landing-page?utm_source=facebook&utm_medium=cpc&utm_campaign=summer_sale_2024
Let’s break down the core components you’ll always use:
utm_source: This identifies the platform sending the traffic (e.g.,google,facebook,newsletter).utm_medium: This specifies the channel (e.g.,cpc,email,social).utm_campaign: This names the specific campaign you're running (e.g.,summer_sale_2024,q4_promo).
The absolute key here is consistency. Create a simple spreadsheet or use a tool to document your naming conventions. This simple step prevents a messy analytics account where facebook, Facebook, and FB are all tracked as different sources, muddying your data.
A well-structured UTM strategy is the difference between seeing a vague spike in "direct" traffic and knowing your email campaign drove $5,000 in sales. It turns ambiguity into hard numbers.
The Critical Role of Tracking Pixels and Events
While UTMs tell you where users came from, tracking pixels and events tell you what they did once they arrived.
A tracking pixel (often called a tag) is a small piece of code you place on your website. Every major ad platform, from Meta to Google, provides one. It's the bridge that connects a user's activity on your site back to the ad they saw.
When someone who clicked your Facebook ad makes a purchase, the Meta Pixel fires off a signal to report that conversion. This is what allows the ad platforms to optimize who sees your ads and, more importantly, gives you the data needed to calculate crucial metrics like Return on Ad Spend (ROAS).
But a pixel on its own is not enough. You have to tell it what actions actually matter to your business by setting up conversion events. These are specific, valuable actions you want users to take.
This simple flow shows how your goals, KPIs, and measurement strategy all tie together.
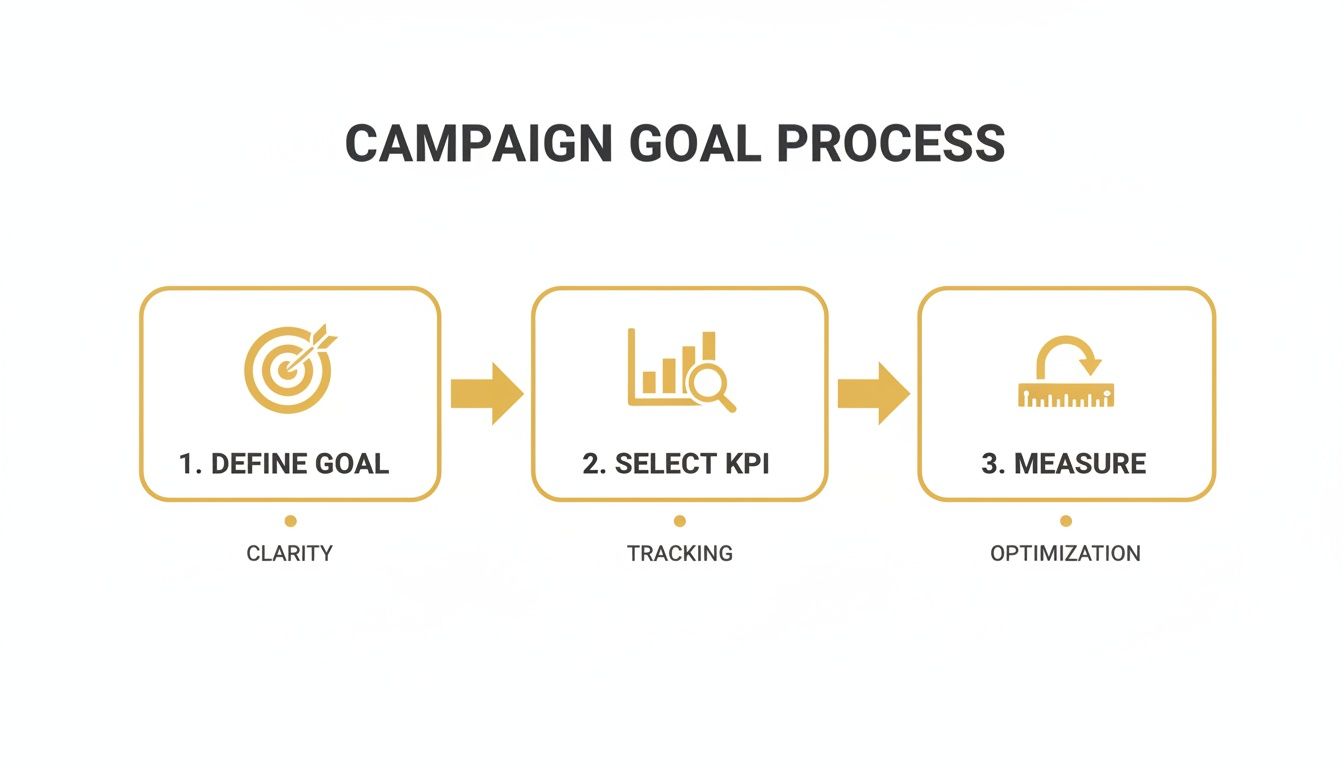
You start with a clear goal, monitor it with specific KPIs, and end up with actionable data. It's a powerful loop.
For an e-commerce store on Shopify, your critical events might be:
- ViewContent: Someone looks at a product page.
- AddToCart: Someone adds an item to their cart.
- InitiateCheckout: Someone starts the checkout process.
- Purchase: A transaction is completed.
For a service business on WordPress, you might track:
- Lead: A user submits a contact form.
- Schedule: A user books a consultation.
- Download: A user downloads a case study or guide.
Setting up these events is what finally connects website clicks to real business value. It lets you see not just how many people visited from a campaign, but how many of them actually turned into qualified leads or paying customers. To see how all these pieces fit into a larger strategy, check out our guide on what is digital marketing analytics.
By combining clean UTM tagging with precise event tracking, you create a data infrastructure you can actually trust. This foundation ensures every metric you analyze is built on a bedrock of accurate information, giving you the confidence to make smarter decisions.
Choosing The Right Attribution Model
So, you've got all your tracking in place. Now for the million-dollar question: how do you give credit where credit is due?
Think about it. A customer might see a Facebook ad on Monday, read a blog post they found on Google on Wednesday, and then finally click a link in your email newsletter on Friday before making a purchase. So... which channel actually made the sale? Facebook? Google? The email?
This is the entire challenge of marketing attribution. It’s the process of figuring out which touchpoints get credit for a conversion. Nailing this is absolutely critical, as it dictates where you spend your next dollar and where you pull back.
Single-Touch vs. Multi-Touch Models
Attribution models basically fall into two camps: single-touch and multi-touch. As the name implies, single-touch models are simple and give 100% of the credit to just one interaction.
-
First-Click Attribution: This one gives all the glory to the very first channel a customer ever interacted with. It's great for understanding what initially brings people into your world, but it completely ignores everything that happens after that first "hello."
-
Last-Click Attribution: This is the polar opposite. It gives 100% of the credit to the final touchpoint right before the conversion. It’s the default for many platforms because it's easy to track, but it has a major flaw. It massively overvalues bottom-of-the-funnel channels (like branded search or email) and often undervalues the top-of-funnel efforts that introduced the customer to you in the first place.
These single-touch models are simple, sure, but they paint a pretty flat, incomplete picture. The real customer journey is rarely a straight line, which is exactly why multi-touch models exist.
A Closer Look at Multi-Touch Attribution
Multi-touch models operate on a more realistic premise: that several marketing efforts probably contributed to a single sale. They offer a much more balanced and insightful view of your performance, helping you see how different channels work together.
Here are the most common multi-touch approaches:
-
Linear Attribution: This is the simplest of the multi-touch models. It just splits the credit equally across every single touchpoint. Four touchpoints? Each one gets 25% of the credit. Easy.
-
Time-Decay Attribution: This model gets a bit smarter. It gives more credit to the touchpoints that happened closer to the conversion. The first interaction gets the least credit, while the final one gets the most.
-
U-Shaped (Position-Based) Attribution: This is a popular hybrid model. It gives 40% of the credit to the very first touchpoint (the introduction) and 40% to the last touchpoint (the closer), then splits the remaining 20% among all the interactions in between.
Choosing an attribution model isn't about finding a single "perfect" solution. It's about selecting the one that best reflects your typical customer journey and your specific business goals. What works for a local service business is often completely wrong for an international e-commerce brand.
To make this a bit more concrete, let's put these models side-by-side.
Comparing Common Marketing Attribution Models
Deciding on an attribution model can feel overwhelming, but breaking them down by how they work and where they shine makes it much clearer. This table compares the most common models you'll encounter.
| Attribution Model | How It Works | Best For | Potential Pitfall |
|---|---|---|---|
| Last-Click | Gives 100% credit to the final touchpoint before conversion. | Businesses with short sales cycles and few marketing channels, like a local plumber. | Drastically undervalues top-of-funnel marketing efforts that build initial awareness. |
| First-Click | Gives 100% credit to the first touchpoint a customer ever had. | Campaigns focused purely on driving new customer awareness and demand generation. | Ignores the impact of all marketing activities that nurture the lead toward a sale. |
| Linear | Distributes credit equally across all touchpoints in the journey. | Brands with longer sales cycles that want to value every interaction equally. | Can fail to distinguish between high-impact and low-impact touchpoints. |
| U-Shaped | Gives most credit to the first and last interactions, splitting the rest. | Businesses that highly value both lead generation and conversion-closing channels. | Might undervalue important mid-funnel nurturing activities like webinars or case studies. |
Ultimately, the goal is to pick a model that gives you the most accurate possible story of how your marketing is actually working.
How to Choose The Right Model For Your Business
So, which one is for you? It really comes down to your business model and sales cycle.
If you're a local service business—say, an emergency plumber—the customer journey is short. Someone's pipe bursts, they search "plumber near me," see your Google Ad, and call you an hour later. In that case, a simple Last-Click model is probably all you need.
But what if you're an e-commerce brand selling a $500 mattress? The journey is much longer and more complex. A customer might discover you on Instagram, read a few blog reviews, watch a YouTube unboxing, and then finally convert through a retargeting ad a month later.
In this scenario, a U-Shaped or Time-Decay model would provide a far more accurate picture. If you relied on Last-Click, you might mistakenly slash the budget for the very Instagram campaign that started the whole journey. For a deeper dive into these concepts, our guide on what is marketing attribution provides even more detail.
My advice? Start simple. If you're just getting started, Last-Click is better than nothing. But as you grow, test a multi-touch model that seems to fit your customer's journey. The goal is to choose the model that gives you the clearest insights to make smarter decisions.
From Data To Decisions: Optimizing Your Campaigns
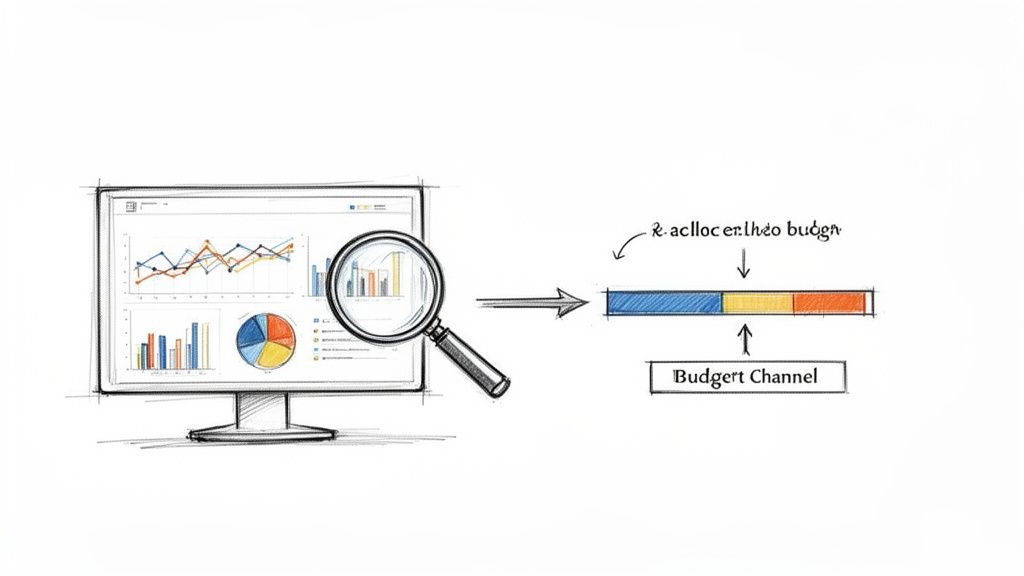
Collecting data is just the starting line. The real work begins when you start turning all those numbers into smart, profitable decisions for your business. You’ve gone through the trouble of setting up your tracking and picking an attribution model, but now you’re staring at a screen full of metrics.
This is where you shift from being a data reporter to a data storyteller. Your job is to find the narrative hidden inside the numbers—a story that clearly points to which campaigns are driving real value and which ones are just burning through your budget. For every metric you see, you need to ask, "So what?"
Building Your Mission Control Dashboard
You can't steer a ship while trying to read a dozen different maps at once. That’s exactly why a centralized marketing dashboard is a non-negotiable. A good dashboard doesn't just throw data at you; it presents a clear, at-a-glance story of your campaign’s health, connecting your big-picture business goals to the specific metrics that actually move the needle.
For most small and mid-sized businesses, a tool like Google's Looker Studio (what used to be Data Studio) is the perfect place to start. It's free, it plays nicely with Google Analytics, Google Ads, and Sheets, and it's surprisingly powerful once you get the hang of it.
Your dashboard should be built to answer your most important questions in seconds:
- Performance Overview: What are my main KPIs—like ROAS, CPA, and Conversion Rate—looking like across all active campaigns?
- Channel Breakdown: Which channels are bringing in the most conversions? More importantly, which ones are the most efficient?
- Pacing: How is my budget spend tracking against my timeline and goals for the month or quarter?
- Funnel Visualization: Where are people dropping off? Is there a leaky bucket somewhere in my conversion path?
The goal here is to graduate from a chaotic mess of spreadsheets to a single source of truth. This dashboard becomes your mission control, letting you spot trends, identify outliers, and make decisions without wasting hours digging for the right numbers.
Uncovering Deeper Insights with Cohort Analysis
Surface-level metrics like your daily conversion rate tell you what happened today. They don't tell you a thing about the long-term value of the customers you're acquiring. This is where cohort analysis comes in to provide a much richer, more honest picture of your performance.
A cohort is just a fancy term for a group of users who share a common characteristic, usually the date they first signed up or made a purchase. By tracking these groups over time, you can answer incredibly valuable questions:
- Do the customers we got from Facebook ads in May have a higher lifetime value (LTV) than the ones from Google Search in June?
- Which campaigns bring in users who actually stick around?
- How long does it really take for a customer from a specific channel to become profitable?
Imagine you're running two campaigns. Campaign A has a fantastic $20 CPA, while Campaign B has a much higher $50 CPA. On the surface, you'd probably double down on Campaign A. But a cohort analysis reveals that customers from Campaign B make repeat purchases for months, leading to a $300 LTV. Meanwhile, customers from Campaign A almost never buy again, capping their LTV at just $40.
Suddenly, the "expensive" campaign is revealed to be far more profitable. This is the power of cohort analysis. It forces you to shift your focus from the immediate cost of acquisition to long-term value, which is how you actually build a sustainable business.
Turning Analysis into Actionable Optimization
Okay, this is the final, most important step: translating your insights into actual, concrete actions. Every piece of data you analyze should lead to a decision. This is how you close the loop and create a cycle of continuous improvement.
For instance, a solid social media marketing plan can deliver a staggering average ROI of 250%, which is $2.50 back for every dollar spent. So when you find out that blending social campaigns with SEO can push your click-through rates from the typical 1-2% to over 3%, you have a clear action item: integrate those strategies. You can find more detail on how to maximize social media marketing effectiveness and see how these channels can work together.
Here’s a simple framework for turning what you've learned into what you'll do next:
| Insight Discovered | Underlying Question | Actionable Next Step |
|---|---|---|
| Your top-performing Facebook ad creative has seen a 30% drop in CTR this week. | Is the audience experiencing ad fatigue? Is the creative stale? | Pause the current ad and launch a new creative variation to the same audience to see if engagement picks up. |
| The bounce rate on your campaign's landing page is an abysmal 85% on mobile devices. | Is the mobile user experience terrible? Is the page slow or hard to navigate? | Conduct a mobile usability test. Focus on page load speed and how clear your call-to-action is on a small screen. |
| A specific blog post is generating lots of organic traffic but has a low conversion rate. | Is the content attracting the right people but failing to give them a next step? | Add a more relevant content upgrade—like a specific checklist or template—to the post to capture leads. |
This systematic approach—analyze, question, act—is what separates successful marketers from those who are just busy. Your data is telling you a story. Your job is to listen carefully and then write the next chapter.
Got Questions? We've Got Answers.
Even the best framework brings up questions once you start digging into the data. Let's tackle some of the most common hurdles I see businesses run into.
How Often Should I Actually Be Checking My Campaign Performance?
This is a classic. The honest answer? It depends entirely on the channel and how long the campaign is running. There’s no magic number, but we can break it down with some common sense.
For your fast-and-furious campaigns—think paid social or search ads—daily check-ins are non-negotiable. You’re watching metrics that can change in an instant, like:
- Cost Per Click (CPC)
- Click-Through Rate (CTR)
- Ad Spend Pacing
A quick five-minute look can tell you if costs are spiking or if an ad has suddenly tanked. Catching that early saves you from burning through your budget on something that's not working.
But for the slow-burn strategies like SEO and content marketing, you need to be more patient. A weekly or bi-weekly review makes way more sense here. You’re looking for trends in organic traffic, keyword rankings, or how a blog post is performing over time—things that just don't move much day-to-day. Checking too often will just drive you crazy.
My advice is to establish a rhythm. No matter what, pull together a comprehensive monthly report. This is your chance to zoom out, see how all the channels are working together, and make smart, strategic calls for the next month instead of just reacting to daily noise.
What Are The Best Free Tools To Get Started With Measurement?
You absolutely do not need an expensive, enterprise-level suite to get started. You can build an incredibly powerful measurement stack for free if you know where to look.
Here’s the starter pack I recommend to every small business:
- Google Analytics 4 (GA4): This is the heart of your operation. It’s your central hub for tracking website traffic, seeing what people do on your site, and, most importantly, measuring if they actually converted. It’s non-negotiable.
- Google Search Console: If you care at all about showing up in Google searches (and you should), this is essential. It tells you exactly which keywords are bringing people to your site and uncovers any technical issues holding you back.
- Native Social Media Analytics: Don’t sleep on the data baked right into the platforms themselves. Meta Business Suite and LinkedIn Analytics have surprisingly robust dashboards for understanding your audience and post engagement.
Once you have these set up, you can pipe all that data into a Google Looker Studio dashboard. It’s a free tool that lets you create clean, visual reports from all your different sources. It’s how you get that single, unified view of what’s really going on.
My Campaign Is Getting Tons Of Traffic But Almost No Conversions. What's Wrong?
Ah, the classic "leaky bucket" problem. This is easily one of the most frustrating things in marketing. You did the hard part—you got people to show up! But if they aren't converting, the campaign is a failure. Almost every time I see this, it boils down to a disconnect between your audience, your ad's promise, and what they experience on your site.
First, get brutally honest about your traffic sources. Is this traffic actually relevant? If your ads are targeting an audience that's way too broad, you’re just paying for clicks from curious people who were never going to buy. Dive into your analytics and see which specific ads, keywords, or audiences are driving traffic with a sky-high bounce rate. Cut them.
Second, put your landing page under a microscope. The problem is often not the ad, but the destination. Ask yourself these questions:
- Is the call-to-action (CTA) button big, bold, and obvious? Does it tell people exactly what to do?
- Does the page load fast, especially on a phone? A 3-second delay is enough to make most people leave.
- Most importantly: does the headline on the landing page perfectly match the promise you made in the ad? If there’s a mismatch, people feel misled and bounce instantly.
The ad got them in the door. It’s the landing page’s job to close the deal. Fixing that disconnect is where you’ll find your conversions.
Ready to stop guessing and start growing with a data-driven strategy? At Up North Media, we specialize in building the web applications and SEO frameworks that deliver measurable results. Get in touch for a free consultation and let’s turn your data into your most valuable asset.