You'll often hear that a "good" ecommerce conversion rate is somewhere between 2% and 4%. But honestly, that's just a starting point. Thinking of it as a universal goal is a bit like asking what a good score is in a game without knowing which game you're playing.
What Is a Good Ecommerce Conversion Rate?

Defining a "good" conversion rate is a classic "it depends" situation. Think of it like defining good gas mileage. A semi-truck getting 10 MPG is fantastic, but a sedan getting 10 MPG is a disaster. The context changes everything.
That 2-4% figure is the industry's highway average—a useful reference, but it doesn't tell you much about your specific performance in stop-and-go city traffic. To really understand how you're doing, you have to zoom in on the variables that make your business unique.
Before we dive deeper, here's a quick cheat sheet on the numbers you'll see discussed.
Quick Guide to Ecommerce Conversion Rates
This table breaks down some of the most common benchmarks you'll encounter. Think of it as a quick reference guide to see where the general industry averages land.
| Metric | Average Benchmark |
|---|---|
| Global Average (All Industries) | 2% – 4% |
| Top-Performing Stores | 5%+ |
| Food & Beverage (High-Performer) | ~6.23% |
| Luxury & Jewelry (Low-Performer) | ~0.95% |
| Desktop Users | ~4% |
| Mobile Users | ~2% |
These numbers give you a bird's-eye view, but the real insights come from understanding the "why" behind them. Let's get into the factors that really shape what a "good" rate looks like for you.
Key Factors Influencing Your Benchmark
A few key things will tell you whether your conversion rate is strong or needs some work. Once you get a handle on these, you can set realistic goals and get a much clearer picture of how to measure digital marketing success.
Your industry is the big one. Conversion rates swing wildly from one sector to another. For instance, the Food & Beverage industry is a top performer, averaging around 6.23%. This makes sense—people are often making repeat purchases of lower-cost items they already know they want.
On the flip side, the Luxury & Jewelry industry sits at the bottom with an average of just 0.95%. This isn't because they're bad at marketing; it's because buying a high-end watch is a much bigger decision than buying a bag of coffee. The buying cycle is longer and more considered.
A 3% conversion rate might be phenomenal for a store selling custom engagement rings, but it would be a major red flag for a shop selling affordable phone cases. Context is everything.
The device your customer is using is another huge piece of the puzzle. Historically, desktop users convert at a much higher rate than mobile users. It's often easier to navigate a complex site and fill out checkout forms on a bigger screen.
That gap is definitely shrinking as mobile experiences improve, but it's still a crucial factor. By understanding these nuances, you can stop chasing a generic number and start focusing on the benchmarks that actually matter to your store.
Where Did These Numbers Even Come From? A Quick History of Conversion Rates
Today's ecommerce conversion rate benchmarks didn't just appear out of thin air. They're the product of decades of wild technological shifts, massive changes in how we all shop, and a slow, hard-won battle for trust in buying things online. Knowing this backstory gives you some much-needed context for your own store’s performance.
Think back to the early days of the internet. We're talking dial-up modems, websites that took a full minute to load a single fuzzy image, and a healthy dose of skepticism about the whole "online shopping" thing. Handing over your credit card details to some faceless website felt like a gamble, and the user experience was often clunky and confusing.
It’s no surprise that conversion rates back then were, well, pretty terrible.
The Dawn of Ecommerce
Between 2000 and 2010, the online shopping world was still finding its footing. Conversion rates were typically stuck somewhere between 1.5% and 2.5%. This was a time of basic website interfaces, very few payment options, and a general lack of confidence from shoppers who were brand new to the idea. Want a trip down memory lane? You can find some great historical ecommerce trends on speedcommerce.com that show just how far we've come.
This was the foundational era, where businesses were just starting to figure out how to build an online store that people would actually trust. Every single sale was a victory against a mountain of technical hurdles and consumer doubt.
The Growth and Trust Phase
The 2010s changed everything. This decade saw the rise of better user experience (UX) design, streamlined checkout processes, and secure payment gateways like PayPal that finally started to build real consumer confidence. Websites got faster, they looked better, and they were a whole lot easier to navigate.
As a result, ecommerce conversion rate benchmarks started to climb, pushing into the 2.5% to 4.0% range. This wasn't just about fancier tech; it was about building relationships with customers and proving that online shopping could be safe, reliable, and genuinely convenient. This period really set the stage for the modern ecommerce experience we know today.
The jump from a ~2% average to a ~4% average is more than just a number—it marks a fundamental shift in how the world shops. It was driven by better design, stronger security, and a new focus on what the customer actually wants.
The Pandemic Shakes Things Up
More recently, the global pandemic acted as a massive accelerant, forcing people to shop online whether they were ready or not. Consumers who had been hesitant before were suddenly buying everything from groceries to furniture online out of sheer necessity.
This sudden surge created a completely new baseline for customer expectations. Shoppers now demand lightning-fast shipping, flawless mobile experiences, and personalized interactions. It's a powerful reminder that conversion rate optimization isn't just about tweaking a button color anymore—it's a constant, strategic response to ever-changing technology and customer demands.
Exploring Conversion Rate Benchmarks by Industry
A global average conversion rate is a good starting point, but it's a bit like knowing the average temperature of the entire planet—it won’t tell you whether to grab a coat or shorts. To get insights you can actually use, you need to measure your store’s performance against direct competitors in your specific industry. This is where ecommerce conversion rate benchmarks really start to shine.
Every industry has its own unique rhythm. Customer behaviors, sales cycles, and average price points are all different, which means performance standards will be, too. A shopper buying their weekly groceries behaves completely differently from someone thinking about a luxury watch, and their conversion rates are going to reflect that.
Why Industry Averages Matter More
Think of it this way: an electronics store selling high-end laptops has a much longer, more considered purchase process than a pet store selling dog food. The laptop purchase involves a ton of research and a significant investment, leading to a slower sales cycle and a naturally lower conversion rate. The dog food, on the other hand, is usually a routine, repeat purchase driven by necessity, which results in a much higher conversion rate.
Comparing both of these stores against a generic 2-4% global average would be totally misleading. The electronics store might be a top performer at 3%, while the pet store could actually be lagging behind at that same number. This is exactly why drilling down into industry-specific data is the only way to set realistic, meaningful goals.
The chart below shows how conversion rates, in general, have been climbing over time, thanks to better technology and growing consumer trust in online shopping.
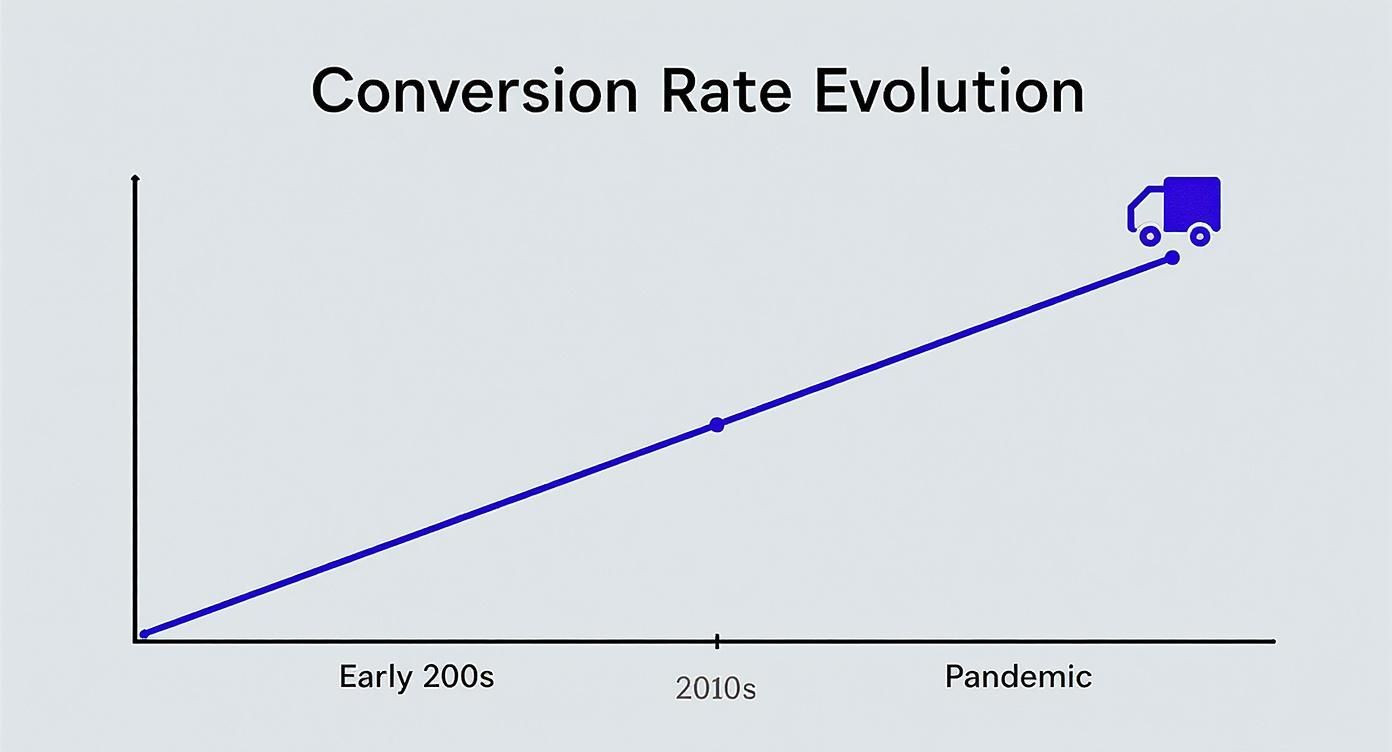
You can see a clear upward trend here, with major events like the pandemic really pushing online shopping habits forward and raising the performance bar for everyone.
Ecommerce Conversion Rate Benchmarks By Industry Vertical
Let’s get into the specifics. The table below breaks down the average conversion rates across several key ecommerce verticals. These numbers, sourced from multiple industry reports, give you a much clearer picture of what "good" looks like in your corner of the market.
| Industry Vertical | Average Conversion Rate (%) |
|---|---|
| Food & Beverage | 6.25% |
| Electronics & Home Appliances | 3.60% |
| Fashion & Apparel | 3.20% |
| Pet Care | 2.32% |
| Luxury & Jewelry | 0.90% |
Keep in mind that these are just averages. Top-performing stores in each category often double or even triple these figures. But knowing the baseline is the first step toward figuring out where you stand and what you should be aiming for.
A Closer Look at Key Verticals
Let's break down the "why" behind these numbers for a few of those key sectors. Understanding the context will help you put your own store’s performance into perspective.
-
Food & Beverage: This sector often crushes it with high conversion rates, sometimes topping 6%. What's the secret? It's all about repeat purchases and lower average order values. Customers are frequently re-ordering essentials, which makes the decision-making process incredibly short and sweet.
-
Electronics & Home Appliances: This industry pulls in solid numbers, with average rates around 3.6%. While these are often higher-ticket items, they're also frequently necessities. Strong brand trust and clear product information can give customers the confidence they need to click "buy." You can dig into more industry conversion statistics on convertcart.com to see how this stacks up.
-
Fashion & Apparel: Conversion rates in fashion usually hover somewhere between 1.5% and 3.2%. This wider range is shaped by things like brand loyalty, the impulse-buy nature of fast fashion, and the constant challenge of getting sizing right online.
-
Luxury & Jewelry: It’s no surprise this category has one of the lowest conversion rates, often dipping below 1%. The high price tags and the need for serious consideration mean the sales cycle is much, much longer. A "conversion" might even happen in a physical store after weeks of online research.
-
Pet Care: With a healthy average conversion rate of about 2.32%, the pet care industry gets a big boost from passionate customers and a ton of repeat, subscription-based purchases for food and supplies.
By measuring your store against the right yardstick, you can stop chasing a vague, universal number and start setting precise, achievable goals that will actually drive real growth for your business.
How Device and Region Impact Conversions

Here's a hard truth: not all traffic is created equal. Understanding where your visitors come from—both in terms of the device they're using and where they are in the world—is critical for making sense of your conversion data.
A visitor casually browsing on their phone during a lunch break is in a completely different mindset than someone researching on a desktop at home. Likewise, cultural shopping habits and local economies mean a customer in North America might behave very differently than one in Asia. Treating all your traffic as one big, uniform group is a huge mistake that can hide both major problems and massive opportunities.
By slicing your data by device and region, you can stop looking at a generic average and start tailoring your efforts for real impact.
The Great Device Divide: Desktop vs. Mobile
For years, we've seen a stubborn gap between desktop and mobile conversions. It's a classic ecommerce dilemma: mobile often drives the majority of traffic—sometimes over 70%—but desktop consistently punches above its weight in closing sales.
This means your biggest audience is often your lowest-converting one. Why? It usually boils down to friction in the user experience. People love using their phones for discovery and initial research, but actually completing a purchase on a small screen can be a pain.
Think about typing in shipping information, trying to compare product details on a tiny screen, or navigating a clunky checkout process. It's just easier on a bigger screen with a full keyboard.
Think of mobile as the window shopping part of the journey—it’s perfect for browsing and getting ideas. Desktop is the fitting room and the cash register, where the final decision and transaction usually happen.
To close this gap, you have to obsess over creating a seamless mobile experience. A great starting point is to check out some top-tier responsive web design examples for inspiration on building a frictionless flow. You can dive deeper with our guide on responsive web design examples.
Global Nuances in Conversion Rates
Just as device matters, geography does too. Shopper behavior, preferred payment methods, and even internet speeds can vary wildly from one region to another, leading to very different ecommerce conversion rate benchmarks for each market.
This is why a localized strategy is so important. Recent data shows some pretty clear regional differences. For instance, the Americas often lead the pack in conversion rates, while other regions might post lower averages due to different market dynamics. Knowing these benchmarks helps you set realistic goals for international growth and spot where your store is either knocking it out of the park or falling behind.
Here’s a quick breakdown of how conversions stack up across devices and key global regions:
- By Device: Desktop users are still the champs, converting at a solid 3.22%, with tablet users right behind at 3.15%. Mobile, despite its massive traffic, lags slightly at 2.96%.
- By Region: The Americas report the highest average conversion rate at 3.2%. Europe, the Middle East, and Africa (EMEA) come in next at 2.98%, while the Asia-Pacific (APAC) region converts at 2.29%. You can explore more of these global conversion rate trends on dynamicyield.com.
This data adds a crucial layer of context. A 2.5% conversion rate might feel disappointing on the surface, but if your main target is the APAC market on mobile, you might actually be outperforming the average. This kind of nuanced view is what lets you interpret your analytics correctly and put your resources where they’ll do the most good.
Using Benchmarks to Improve Your Store Performance
Knowing your industry's ecommerce conversion rate benchmarks is one thing, but actually using them to make more money is the real goal. Raw data is just noise until you turn it into a concrete action plan. This is where you translate numbers on a dashboard into a real-world strategy for growing your revenue.
Think of benchmarks as the "check engine" light for your online store. If that light comes on—meaning your conversion rate is trailing the average for your industry—it's a crystal-clear sign that something under the hood needs a look. Your job is to pop the hood, diagnose the problem, and make the right tweaks to get your store running like a well-oiled machine again.
The whole process starts with a simple but non-negotiable first step: accurately calculating and consistently tracking your own conversion rate. This number is your baseline, your starting point for every single decision that follows.
Select the Right Yardstick for Comparison
Once you have your own numbers in hand, the next move is to pick the right benchmark to compare them against. A classic mistake is grabbing some broad, global average and treating it like gospel. That’s like a small-town boutique comparing its daily foot traffic to a massive shopping mall in New York City—the context is so wildly different that the comparison is totally useless.
A US-based fashion brand, for instance, should be looking at benchmarks for the North American apparel industry, not a global average that lumps in electronics stores in Asia. Context is absolutely everything. You have to slice and dice the data to find the most relevant comparisons for your store.
Here are a few things to consider when choosing your benchmark:
- Industry Vertical: Are you comparing your store to direct competitors in your niche (e.g., pet supplies, luxury watches, craft goods)?
- Geographic Region: Stick to data that’s specific to the primary countries or regions you sell to.
- Device Type: You have to analyze your mobile, desktop, and tablet conversion rates separately. They tell very different stories.
Speaking of devices, that nuance is mission-critical. For example, desktop conversions consistently outperform mobile at 4.8% versus 2.9%, even though mobile usually brings in the lion's share of traffic. These kinds of specific benchmarks give you powerful, actionable insights to customize your optimization strategy.
Bridge the Gap with Proven Strategies
If you find a gap between your store’s performance and the benchmark, don't freak out. This is an opportunity. The data is literally pointing you toward the exact areas that need improvement. This is where you shift gears from analysis to action.
A low mobile conversion rate isn't a failure—it's a clear instruction to improve your mobile checkout flow. A high cart abandonment rate is a signal to enhance trust with social proof and clearer shipping information.
To move beyond just understanding benchmarks and start actively improving your store's performance, it's time to dig into actionable conversion rate optimization best practices. This will give you a playbook of proven tactics you can start using today.
From optimizing your product pages with high-quality images and compelling descriptions to radically simplifying your checkout process and leveraging social proof like customer reviews, there are countless ways to close that performance gap. Our own comprehensive guide on how to improve website conversion rates offers a detailed roadmap.
By methodically identifying your store's weak spots and applying targeted solutions, you can turn data into a direct driver of sales and real growth for your business.
Common Questions About Ecommerce Conversion Rates
Alright, after diving into all that data, you probably have a few more questions rattling around. The world of ecommerce conversion rate benchmarks is full of quirks and "it depends" answers, and getting a handle on them is what separates the pros from the amateurs.
Think of this section as a quick FAQ. We'll tackle the practical stuff, like how often you should even be looking at your numbers and why trying to match Amazon's conversion rate is a recipe for a headache. Getting these details right will help you sidestep common mistakes and focus on what actually moves the needle.
How Often Should I Check My Conversion Rate?
There's no single magic number here—it really depends on how much traffic you get. A store with thousands of visitors a day can spot meaningful trends in a 24-hour cycle. But if you're a smaller shop, you might need a full week or even a month to collect enough data to know if a change is a real signal or just noise.
Here’s a good rule of thumb: peek at it weekly to make sure nothing is horribly broken, but base your big strategic decisions on monthly data. This keeps you from freaking out over a slow Tuesday while still letting you catch major issues before they do real damage.
The key is consistency, not just frequency. Pick a schedule that works for you and stick to it. That’s how you’ll start to see the patterns that matter.
What Are Micro-Conversions and Why Do They Matter?
A macro-conversion is the big one—the finish line. For an ecommerce store, that’s a completed sale. But a customer doesn't just appear at the checkout. They take a bunch of smaller steps along the way, and those little actions are what we call micro-conversions.
Think of them as signposts on the path to purchase. They aren't the final destination, but they prove your customer is heading in the right direction. Tracking them is absolutely critical for figuring out where your sales funnel is leaking.
Here are a few classic examples of micro-conversions:
- Adding a product to the cart: This shows someone is interested enough to take the next step.
- Signing up for a newsletter: They like your brand and want to hear more from you.
- Creating a user account: This is a strong signal of a potential repeat customer.
- Watching a product video: They're doing their homework and are seriously engaged.
If your add-to-cart rate is sky-high but your final purchase rate is in the gutter, you instantly know the problem isn't on your product pages—it's somewhere in your checkout flow.
Why Isn't My Conversion Rate as High as Amazon's?
It’s so easy to look at a giant like Amazon—which pulls in conversion rates well into the double digits (sometimes over 70% for Prime members)—and feel like you're failing. But you’re not playing the same game. Honestly, it’s not even the same sport.
Amazon has spent decades building trust, stockpiling a near-infinite product selection, and creating an ironclad ecosystem with perks like one-click ordering and Prime shipping. Most people land on Amazon with their credit card practically in hand, knowing exactly what they want. Your store, on the other hand, is probably still trying to win over customers who are in the discovery phase.
Forget Amazon. Focus on your own industry benchmarks and, more importantly, on beating your own numbers from last year. That’s a game you can actually win.
Can a High Conversion Rate Be a Bad Thing?
Believe it or not, yes. A high conversion rate can sometimes be a vanity metric that hides a sick business.
Imagine a store that hits a 10% conversion rate. Sounds amazing, right? But what if they did it by running a massive, store-wide 70% off sale? The sales volume might look fantastic on a chart, but the profit margins could be completely wiped out, or even negative. That's not a growth strategy; it's a fast track to going out of business.
You have to look at your conversion rate alongside other vital signs of health, like Average Order Value (AOV) and, of course, profitability. The real goal isn't just to boost a percentage—it's to grow your revenue sustainably.
Ready to turn these insights into action and see real growth? Up North Media specializes in data-driven SEO and custom web development designed to boost your conversion rates and accelerate your revenue. We help businesses in Omaha and beyond build powerful, user-friendly ecommerce platforms that turn visitors into loyal customers. Get in touch for a free consultation and let's build your success story together. Learn more at https://upnorthmedia.co.