Your analytics dashboard says people are visiting. Your ad platform says campaigns are driving clicks. Your store or site looks polished. But revenue stalls, signup rates wobble, or loyal readers vanish after one visit.
That's where most business owners get stuck. They can see activity, but they can't see intent.
User behavior analytics closes that gap. It helps you move from surface metrics to patterns that explain why people buy, hesitate, return, ignore a feature, abandon a form, or trigger a security concern. For a business owner, that matters because the same discipline that helps you spot a broken checkout flow can also help you catch a compromised account, identify a weak onboarding path, or learn which audience segment deserves more budget.
Think of it as reading digital body language. A visitor who clicks three pricing tabs, starts a form, pauses, and exits is telling you something. An employee who suddenly downloads unusual files at odd hours is telling you something too. In both cases, the raw action matters less than the pattern.
That's why smart teams no longer separate growth analytics from security monitoring as sharply as they used to. The underlying question is the same: what are people doing, what's normal, and what deserves attention?
A useful starting point is building effective customer profiles. Profiles turn scattered activity into recognizable audience patterns, which makes behavior data easier to act on.
Beyond Clicks Understanding the Why Behind User Actions
A business owner often sees the symptom first. Product pages get traffic, but checkout completion lags. A publisher sees article views, but subscribers don't stick. A service company gets form starts, but not many finished submissions.
Traditional reporting tells you what happened. User behavior analytics helps you understand why it happened.
Where standard reporting falls short
A pageview spike can look healthy while the experience underneath is broken. If users land on a page and scroll without clicking the primary call to action, that's a signal. If they repeatedly revisit pricing, compare plans, and leave, that's another signal. If they come back after reading support content, your content may be doing sales work that your team isn't measuring properly.
UBA takes these disconnected moments and turns them into patterns. Instead of staring at totals, you start asking sharper business questions:
- Why are users stopping at this step?
- Which actions usually happen before a purchase or signup?
- Which behaviors show strong intent but weak conversion?
- Which actions suggest risk rather than routine use?
Digital body language is often more honest than survey answers
People don't always explain their friction clearly. But behavior leaves clues. Hesitation, repetition, backtracking, unusual access, abandoned flows, and sudden bursts of activity all tell a story.
Practical rule: If you only track outcomes, you're always reacting late. If you track behavior patterns, you can intervene earlier.
That's why UBA matters across both growth and protection. For marketing and product teams, it reveals friction, motivation, and loyalty. For operations and security teams, it highlights deviations from normal use that may point to account misuse, insider risk, or fraud.
At a practical level, this is less about fancy dashboards and more about operational clarity. You stop debating opinions and start investigating evidence.
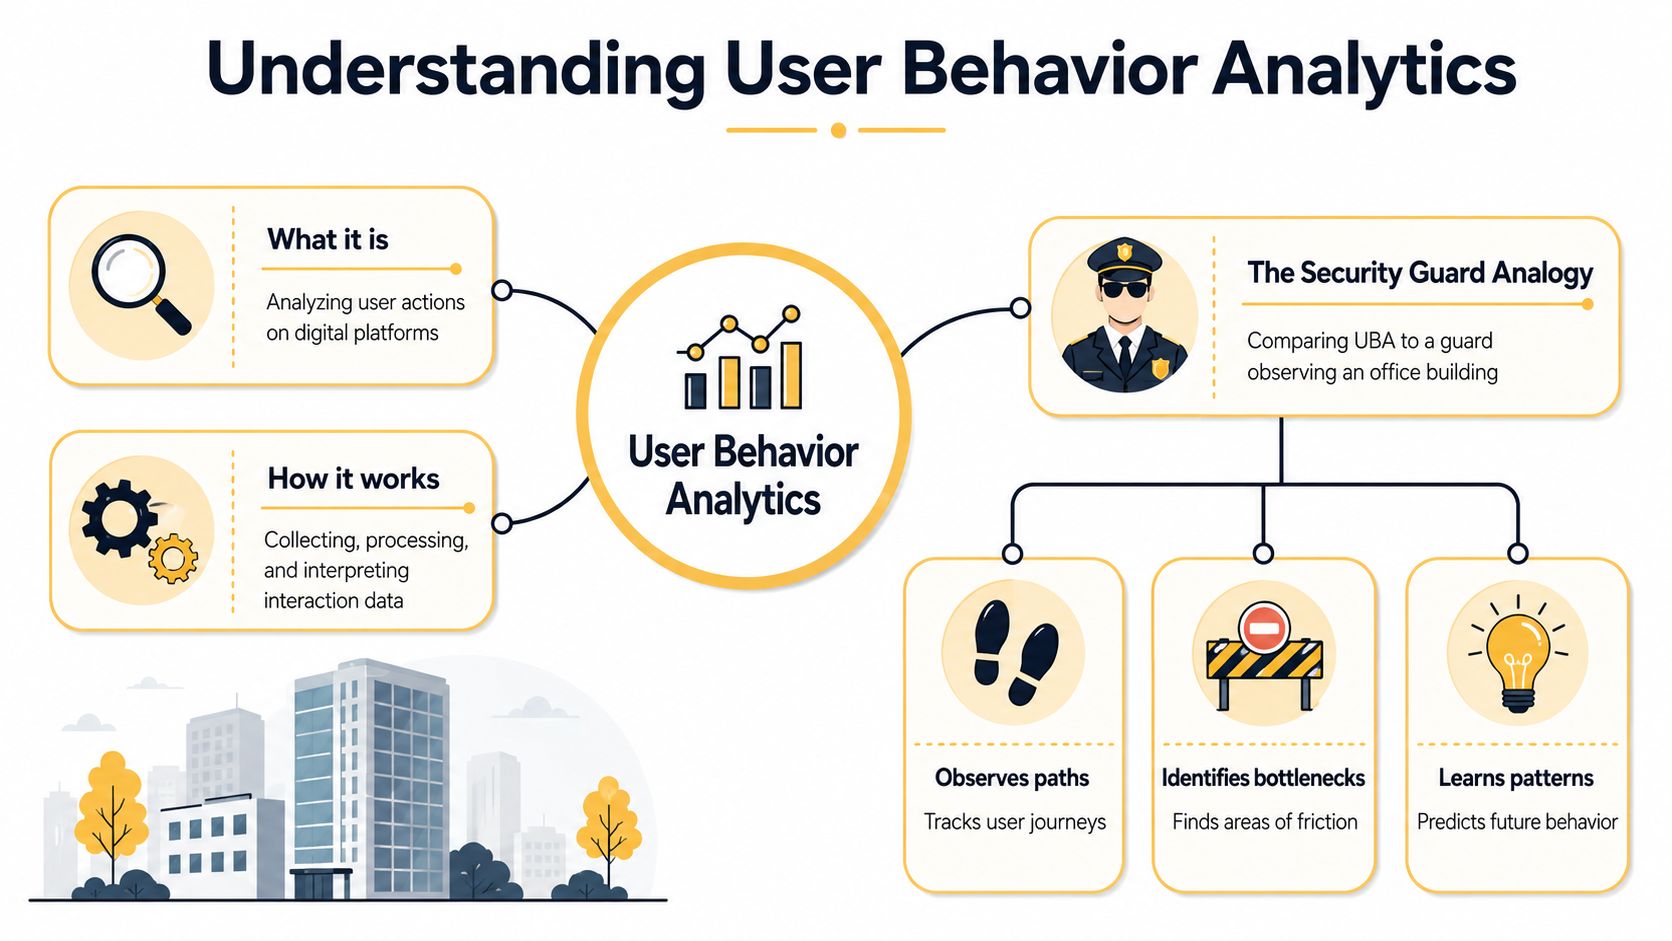
What Is User Behavior Analytics and How Does It Work
User behavior analytics is the practice of analyzing how people interact with your website, app, systems, or accounts so you can identify patterns that matter. In marketing and product work, that usually means studying clicks, signups, feature usage, retention, and funnel drop-offs. In cybersecurity, it means looking for behavior that doesn't fit a person's normal routine.
One useful analogy is a security guard in an office building.
The security guard analogy
A good guard doesn't treat every person as suspicious. They learn the normal rhythm of the building. They know who usually arrives early, which teams use which floors, what a normal delivery looks like, and which doors people rarely use.
When something breaks that pattern, the guard pays attention.
That's how UBA works in digital systems. It builds a baseline of normal behavior from historical data, then compares current activity to that baseline. If the system sees someone logging in from an unusual place, accessing files they rarely touch, or moving through an app in a strange sequence, it flags the activity as anomalous.
The mechanics in plain English
Here's the simple version of how most UBA systems work:
- Collect behavior data from logs, app events, network activity, feature usage, and other digital touchpoints.
- Establish normal patterns for users or user groups.
- Monitor live activity against those patterns.
- Flag anomalies when behavior deviates in meaningful ways.
- Assign risk or priority so teams know what deserves investigation first.
In cybersecurity, that model fills a visibility gap. A SANS Institute survey cited by SaaS Alerts found that 35% of respondents lack visibility into insider threats, and the same source explains that UBA addresses this by using statistical analysis and machine learning to examine behavior patterns and detect irregularities tied to malicious activity.
Key terms business owners should know
| Term | Plain-English meaning | Why it matters |
|---|---|---|
| Baseline | A record of normal behavior | You can't spot unusual activity unless normal is defined |
| Anomaly | A meaningful deviation from normal behavior | This is where hidden friction or hidden risk appears |
| User profile | A behavior-based picture of how a person or segment usually acts | Helps separate routine variation from real concerns |
| Risk score | A priority rating based on severity and context | Keeps teams from treating every signal as equally urgent |
A short walkthrough helps make it concrete:
What UBA is not
UBA is not just a heatmap. It's not just pageview reporting. And it's not a magic box that fixes conversion or security problems on its own.
A useful UBA setup doesn't replace judgment. It gives your team better evidence, earlier.
That's the part many businesses miss. The software identifies patterns. Your team still has to decide whether the pattern points to UX friction, buyer hesitation, employee error, fraud, or a real attack.
UBA in Action Real-World Use Cases and ROI
The fastest way to understand UBA is to look at where it pays off. In practice, the return usually shows up in one of three places: better conversion paths, stronger audience engagement, or earlier risk detection.
E-commerce stores use UBA to find revenue leaks
An online store rarely has one conversion problem. It usually has several smaller ones stacked together. A shipping page creates doubt. A discount code field distracts users. Mobile visitors struggle with form fields. Returning buyers behave differently from first-time visitors.
UBA helps teams isolate the behavior patterns behind those leaks.
For example, you can track whether buyers who view reviews convert more often than buyers who jump straight to the cart. You can compare behavior by traffic source. You can identify whether users abandon after selecting shipping, after seeing fees, or after trying to sign in.
That's why UBA pairs well with broader work on Conversion Rate Improvement for Apps. The point isn't only to collect more events. It's to identify which behaviors signal intent and which moments introduce friction.
A practical extension is to connect those findings with proven conversion rate optimization strategies so behavior data turns into page, offer, and UX changes.
Publishers and content businesses use UBA to shape engagement
For publishers, not every pageview carries the same value. Some readers skim. Some binge related articles. Some return regularly and engage thoroughly with certain topics, formats, or authors.
UBA makes those patterns visible. Editorial teams can see which content paths produce subscriptions, which sections create repeat visits, and where readers lose interest. Sales teams can use the same patterns to understand what kind of audience engagement supports premium inventory or sponsorship value.
A vanity metric mindset says, “This article got traffic.” A UBA mindset asks, “What sequence of content keeps the right readers coming back?”
Small and midsize businesses use UBA to reduce preventable risk
The cybersecurity aspect becomes very practical, as a MITRE D3FEND entry on User Behavior Analysis describes UBA as a cybersecurity process defined by Gartner that detects insider threats, targeted attacks, and financial fraud by analyzing patterns of human behavior and using statistical algorithms to identify anomalies such as repeated login attempts from a single IP address or large, abnormal file downloads.
For an SMB, that means UBA can help answer questions like:
- Is this employee account behaving normally?
- Does this login pattern fit the user's usual habits?
- Is this file access routine, or does it deserve review?
The ROI from security-focused UBA often comes from avoiding the wrong kind of surprise.
That return doesn't always show up as a neat line item in a growth report. It shows up in the absence of disruption, fraud, account misuse, and slow incident discovery.
One framework, two business outcomes
UBA works best when you stop treating growth and security as separate conversations.
| Business area | What UBA watches | What you gain |
|---|---|---|
| Marketing | Entry paths, engagement signals, content interactions | Better targeting and clearer campaign quality |
| Product | Feature usage, onboarding flow, retention behavior | Smarter roadmap priorities |
| Sales | High-intent actions, repeat visits, pricing interactions | Better lead qualification |
| Security | Access patterns, downloads, login behavior | Earlier detection of suspicious activity |
That's the payoff. One discipline helps you protect assets while improving experience.
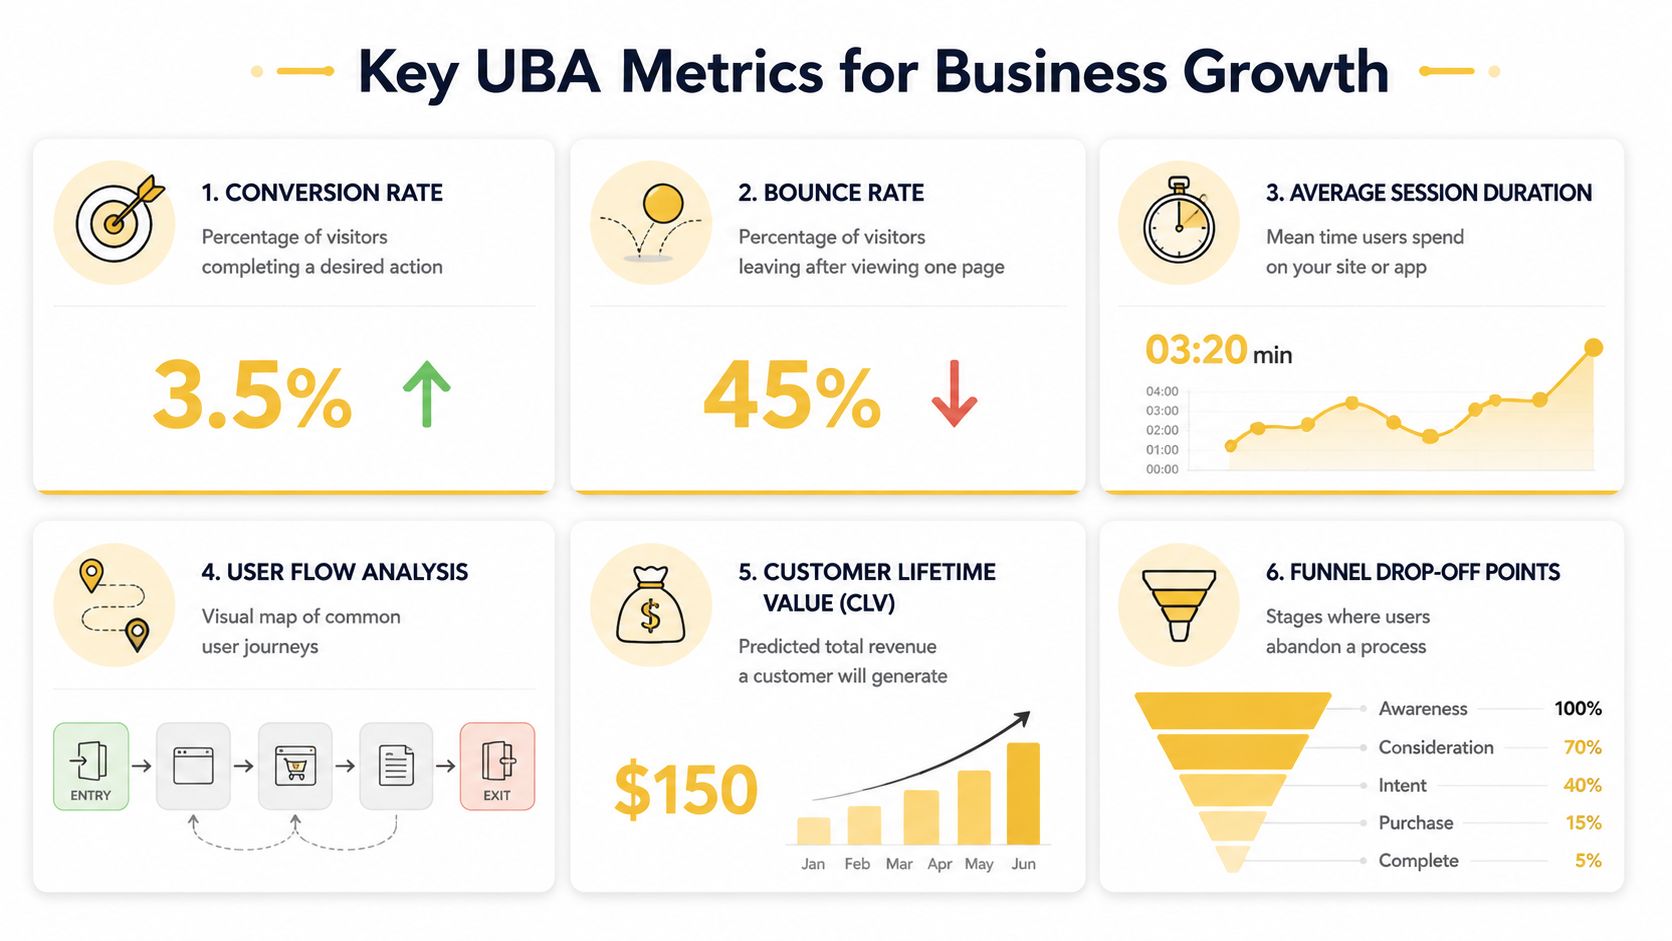
Essential Metrics to Track in Your UBA Dashboard
A good UBA dashboard doesn't drown you in charts. It answers business questions quickly. If you're a business owner, the right metrics are the ones that tell you where users are getting value, where they're getting stuck, and which segments behave differently enough to deserve a different strategy.
Start with questions, not widgets
A useful dashboard usually begins with questions like these:
- Are people using the features we invested in?
- Do new users reach the point where the product makes sense to them?
- Where exactly do users drop out of the funnel?
- Which customer groups stay engaged over time?
- Did a pricing or UX change alter behavior for better or worse?
The Amplitude overview of user behavior is helpful here because it calls out the specific metrics most tied to product success: feature usage and impact, stickiness, retention rates, activation rates, and funnel drop-offs for in-app purchases. It also notes that these metrics help teams evaluate things like the effect of pricing changes on retention or the popularity of a feature within a user cohort.
The handful of metrics that carry real weight
Feature usage and impact
This tells you whether people use what you built. Not in theory. In practice.
If a feature is important to your positioning but barely appears in normal user paths, you've learned something critical. The issue may be discoverability, onboarding, pricing, or weak product-market fit.
Stickiness
Stickiness shows whether users come back and how naturally the product fits into their routine. A sticky feature becomes part of habit. A non-sticky one may still be useful, but it won't drive long-term value on its own.
Activation rate
This is one of the most important early signals. It tells you whether new users reach the first meaningful outcome that proves the product's value. If activation is weak, retention often suffers later.
Watch this closely: Many teams blame churn when the real problem is that users never reached value in the first place.
Funnel drop-offs
Funnel analysis shows where a user journey breaks. That may be a checkout step, a signup flow, a paywall interaction, or an onboarding sequence.
The most useful habit here is to study specific steps, not only total completion rates. A broad conversion chart can hide the exact point where confusion or mistrust appears.
Retention by cohort
Retention becomes more useful when you compare groups. Users who signed up during one campaign may behave differently from users who came through organic search, a referral partner, or a product launch.
That's why dashboards should include some form of cohort view. It reveals whether behavior changes are lasting or temporary.
Keep the dashboard tied to decisions
A dashboard should help someone act, not admire reporting. One practical way to frame it is this:
| Business question | Metric to check | Likely action |
|---|---|---|
| Are new features landing? | Feature usage and impact | Improve onboarding or deprioritize weak features |
| Are users forming habits? | Stickiness | Strengthen repeat-use triggers |
| Are new users getting value fast enough? | Activation rate | Simplify first-run experience |
| Where do people give up? | Funnel drop-offs | Fix copy, forms, trust signals, or UX |
| Which groups deserve different treatment? | Retention by cohort | Personalize messaging and product paths |
For teams that want a broader context around measurement, this guide to digital marketing analytics complements UBA well because it helps separate behavioral insight from vanity reporting.
A Strategic Roadmap to Implementing UBA
Most businesses don't fail at UBA because the concept is wrong. They fail because they install tracking before they define decisions. The result is predictable: too much data, weak context, unclear ownership, and a team that stops trusting the alerts or ignores the dashboard.
A better approach is to treat UBA as a business system, not a software purchase.
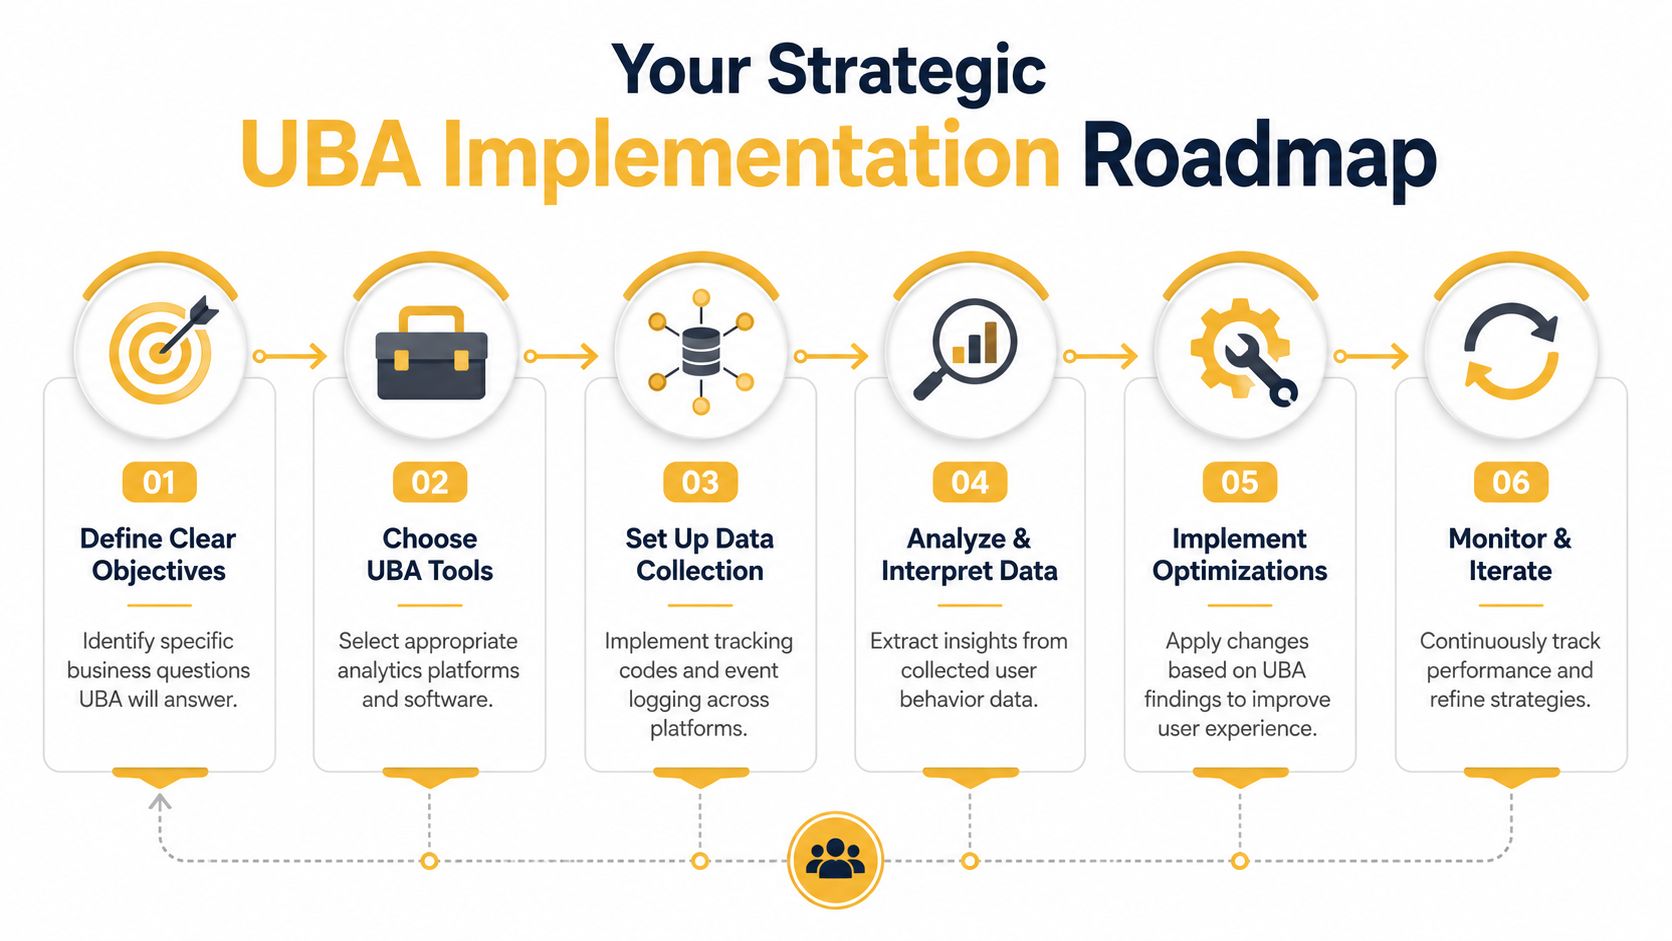
Step one begins with one question that matters
Start narrow. Pick the highest-value behavior question in your business.
For an e-commerce brand, that might be: “Why do users begin checkout but not finish?” For a SaaS product, it may be: “What behavior predicts long-term retention?” For an SMB with sensitive systems, it could be: “What user activity would signal account misuse early enough to respond?”
That first question determines what data you need, which teams should be involved, and what success looks like.
Build around objectives, not platforms
Some businesses jump straight into tools and end up collecting events they never use. A better sequence looks like this:
- Define the business objective
- Map the behaviors tied to that objective
- Choose the toolset that can capture those behaviors
- Assign owners for action, not just reporting
The right setup may include product analytics, web analytics, log monitoring, CRM data, and customer support signals. In security use cases, identity and access context often matters just as much as behavior itself.
Decide what “normal” should mean in your business
This is the part many teams underestimate. UBA depends on context. A spike in downloads might be suspicious in one department and totally normal in another. A burst of evening logins may be routine for a distributed team but unusual for a local office.
That's why baselines should reflect actual workflows, customer journeys, and access patterns. Generic thresholds create noise.
A practical way to think about implementation is to define behavior at three levels:
- User-level behavior for individual patterns
- Segment-level behavior for roles, cohorts, or audience groups
- Journey-level behavior for common sequences such as signup, checkout, or content progression
Collect data you can actually use
Good UBA data is clean, intentional, and tied to decisions. That means logging the events that matter most, naming them consistently, and making sure your team can connect behavior across relevant systems.
For growth teams, that often includes:
- Entry source and landing behavior
- Key feature interactions
- Form starts and form completions
- Checkout or signup progression
- Repeat visits and return intervals
For security teams, the event mix often shifts toward:
- Login patterns
- Access requests
- Application interactions
- File access behavior
- Network-related activity
This is also where privacy discipline matters. Collect what supports your use case, document it clearly, and align implementation with the consent, disclosure, and data-handling obligations that apply to your business.
UBA gets stronger when the data is sharper, not when the dataset is merely bigger.
Prepare for false positives before they flood the team
This is one of the most important trade-offs in real deployments. UBA sounds elegant in vendor demos because anomaly detection always looks obvious in a clean example. Real environments are messier. People travel. Teams change workflows. Marketing campaigns alter behavior. Product launches create temporary spikes.
That's why false positives become a serious operational problem. A Living Security analysis of user behavior analytics notes that 65% of security teams report high false-positive rates in UBA deployments because they lack contextual signals. The same source says an emerging 2025 to 2026 trend is a shift toward UEBA with machine learning that correlates multiple signals into actionable narratives, reducing investigation time by 40% and improving incident response.
For business owners, the takeaway is simple: behavior alone is often not enough.
What works better than raw anomaly alerts
| Weak setup | Stronger setup |
|---|---|
| One isolated behavior signal | Multiple correlated signals |
| Static thresholds | Dynamic profiles |
| Alerts with no narrative | Alerts with context and sequence |
| Separate teams using separate data | Shared visibility across product, marketing, and security |
If someone logs in oddly once, that may be harmless. If that unusual login is followed by abnormal file access and a sudden permissions change, the pattern becomes more meaningful.
That same logic applies outside security. A user who pauses in checkout might be uncertain. A user who pauses, revisits shipping, opens help content, and exits repeatedly is signaling a stronger usability issue.
Put UBA inside daily workflows
The businesses that get value from UBA don't leave it in a dashboard tab.
They tie it to operating routines. Marketers use behavior patterns to refine audience segmentation and landing page priorities. Product teams use them to rank fixes and decide what enters the backlog. SEO teams can compare behavioral depth by query intent, not just rankings, and learn which topics attract the right users rather than just more users. If you're personalizing pages or messaging, guides on dynamic website content can help turn behavioral signals into more relevant user experiences.
A workable operating cadence
- Weekly review for growth teams to spot funnel friction, feature adoption shifts, and audience changes
- Regular security review to investigate high-context anomalies and tune detection rules
- Monthly leadership check-in focused on decisions made from behavior insights, not just reports produced
- Quarterly instrumentation review to remove noisy tracking and add missing signals
Choose actions that are easy to validate
Don't start by trying to transform the whole business. Pick changes you can test and observe.
A marketer might change the sequence of a landing page based on where engaged users hesitate. A product manager might simplify the first-run flow after activation analysis. A security lead might tighten authentication requirements for accounts that show abnormal patterns instead of escalating every alert manually.
That's where UBA becomes practical. It stops being an abstract analytics initiative and starts functioning like a decision engine.
Conclusion Your Next Step with UBA
If you've been asking what is user behavior analytics, the shortest useful answer is this: it's a way to understand patterns in how people act so you can improve experience, reduce risk, and make better business decisions.
That matters because most companies already have data. What they lack is interpretation. They know users clicked, visited, signed in, bounced, or stalled. They don't always know what those actions mean in context.
The technical foundation is straightforward. A Varonis explanation of user behavior analytics describes the core mechanism as establishing a dynamic baseline of normal behavior from historical activity logs, then assigning risk scores to anomalies based on severity, frequency, and context. For a business owner, that translates into something practical: define normal, monitor deviations, and respond where the pattern matters.
Start there. Don't begin with a giant tool rollout. Begin with one question:
What user behavior in my business do I most need to understand right now?
That's the first step toward a site that converts better, a product that retains more users, and a business that catches problems earlier.
If you want help turning behavior data into a clearer growth and optimization strategy, Up North Media works with businesses that need practical support across web development, SEO, analytics, and AI-driven improvement. A focused outside perspective can help you identify the few user behaviors that matter most, then build the systems to act on them.