
Less than 25% of customer feedback leads to action today, according to Quantum Metric benchmark reporting summarized here. That's the number that should reset how you think about customer feedback analysis.
Teams don't have a listening problem. They have a routing problem. Surveys come in, reviews pile up, support tickets multiply, someone builds a dashboard, and nothing changes in product, SEO, retention, or conversion. That isn't a research issue. It's an operations failure.
I've seen this with e-commerce brands drowning in return reasons and on-site search failures, and with SaaS teams staring at NPS charts that never tell them what to fix next. The companies that get value from customer feedback analysis treat it like a pipeline. Inputs come from every touchpoint. Feedback gets normalized, tagged, prioritized, assigned, and pushed into decisions with owners and deadlines.
That's the only approach that scales for small and mid-sized teams. You don't need a huge CX department. You need one decision layer that pulls fragmented customer signals into the same system, then forces action.
Why Most Customer Feedback Programs Fail Before They Start
Less than 25% of customer feedback leads to action today, as noted earlier. That number explains why so many VoC programs disappoint. Teams keep funding collection, then skip the operating model that turns raw feedback into decisions.
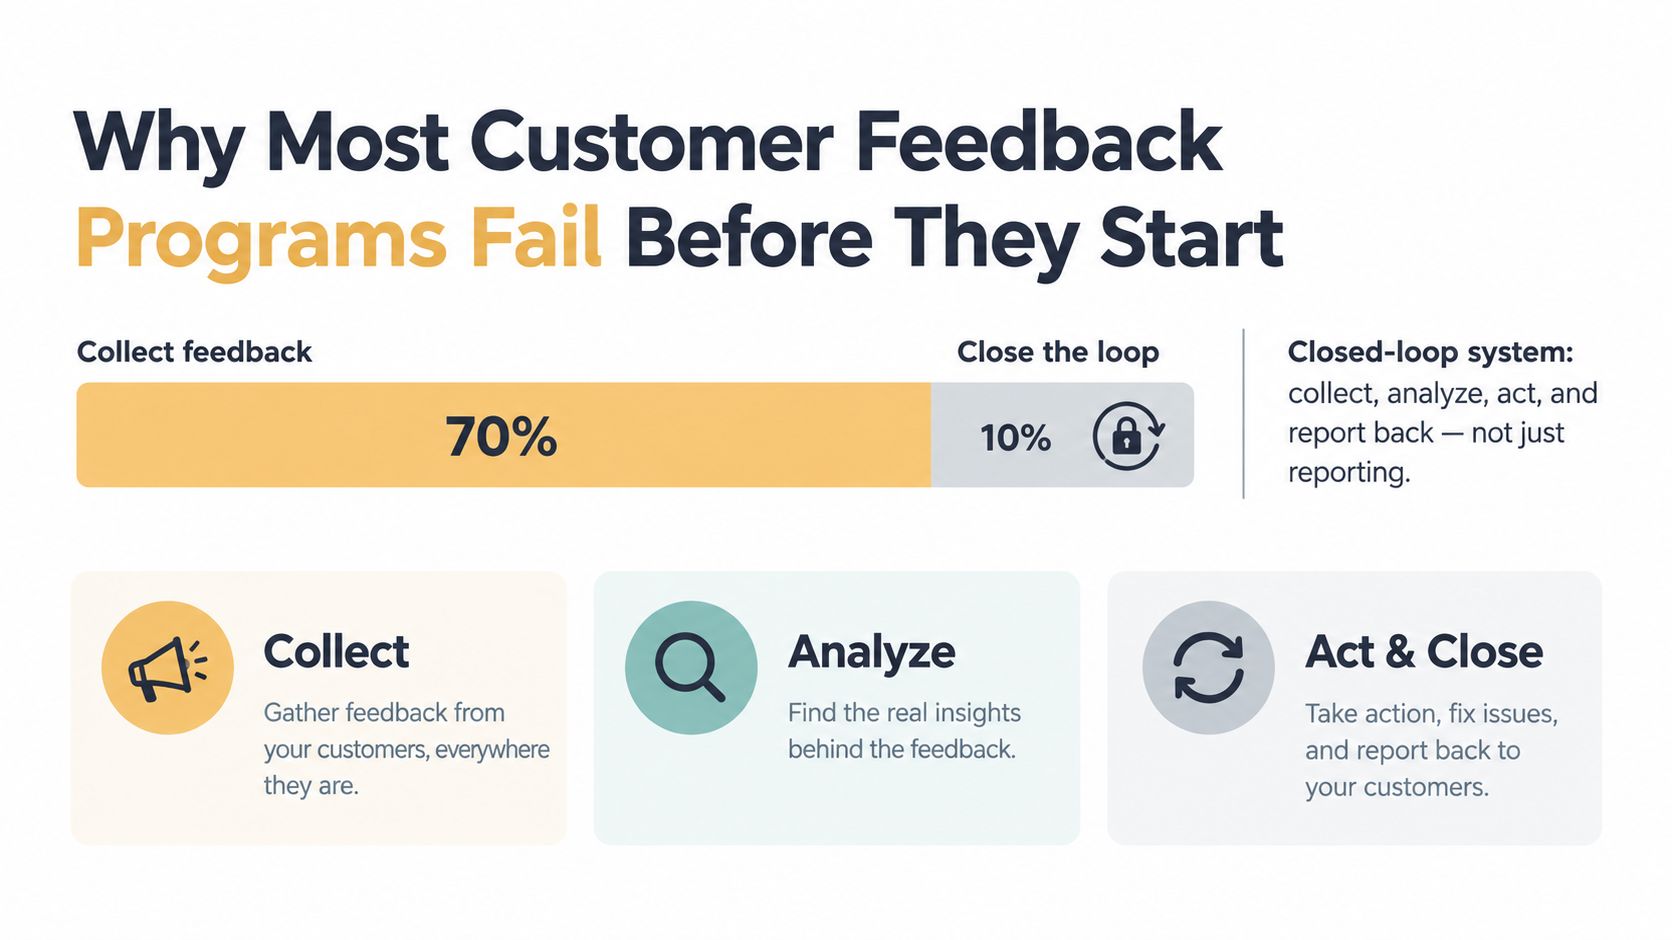
I judge a feedback program on four points right away. Who owns the pipeline. How feedback gets classified. What rules decide priority. How actions get assigned and tracked. If one of those is missing, the team does not have a feedback system. It has a pile of opinions spread across tools.
Small and mid-sized teams get tripped up here because they frame feedback as a survey project. It is an operations pipeline. Survey responses are one input. Support tickets, reviews, refund reasons, sales objections, search queries, and chat logs belong in the same decision layer. If they stay fragmented, the same complaint shows up in five places and still fails to trigger one clear fix.
The four failure modes
Sampling bias sinks programs early. Survey responses only capture a narrow slice of customers, and the slice is usually skewed toward people who are very happy, very annoyed, or unusually engaged. If your roadmap, messaging, or retention work depends on survey data alone, you are making decisions with missing context.
Ownerless feedback is the next failure. Marketing sends the survey. Support manages the inbox. Product logs feature requests. Success handles renewals. Nobody owns the full intake and routing process, so nobody is accountable for turning repeated signals into one ranked issue list.
Dashboard vanity wastes time fast. Sentiment charts and NPS trend lines look polished, but they rarely answer the question an executive or team lead should ask every week: what changed because customers kept saying the same thing?
Collection without taxonomy burns budget. If you collect open text before setting categories, severity rules, and escalation paths, your team will spend months arguing over interpretation. Tagging discipline matters more than sending one more survey.
Practical rule: If feedback does not have an owner, a category, and a next action, it is still raw input.
What inaction actually costs
This failure is expensive because feedback problems do not stay inside CX. They spread into churn, lower conversion, weak onboarding, support volume, refund rates, and paid traffic that lands on broken experiences. An e-commerce brand sees it in return reasons and failed search behavior. A SaaS company sees it in trial drop-off, repeated onboarding confusion, and expansion revenue that never materializes.
Negative feedback is often the highest-signal input in the system because it points to friction customers want fixed now. Teams that need a better response playbook should read SuperX's pro advice on negative feedback. Use criticism as triage input, not as a reputation problem to hide.
The fix is blunt. Stop launching feedback initiatives without a pipeline owner, a shared taxonomy, and action rules. Customer feedback analysis starts failing before it starts when teams buy collection tools before they design the operating system.
Building the Data Foundation Across Every Touchpoint
Many teams already have enough feedback. They just have it scattered across too many systems to use it well.
The fix is simple in concept and messy in execution. Inventory every source. Normalize fields. Remove duplicates. Land everything in one dataset. Then tag and review from there.
What to pull into the same dataset
The obvious sources are surveys, support tickets, and public reviews. The high-signal sources people skip are usually more useful:
- Support transcripts: Chat logs and ticket notes usually contain root-cause language customers never put in surveys.
- Sales call recordings: Prospects explain objections, confusion, and competitor comparisons in plain language.
- Refund reasons: These often reveal product expectation gaps faster than a satisfaction score ever will.
- Social DMs and comments: Messy, informal, and often brutally honest.
- On-site search queries: These show what customers expected to find and didn't.
- In-app behavior events: These aren't “feedback” in the survey sense, but they give essential context for interpreting complaints.
- Review platforms: G2, Trustpilot, Google, app stores, and niche directories all capture different customer moments.
A lot of small businesses try to solve this inside one survey platform. That's the wrong model. Recent literature points to the bigger gap being cross-platform, real-time integration across reviews, social, support chats, and other touchpoints, with fragmented frameworks and limited unified CX management called out in this 2025 cross-platform sentiment review.
A lightweight stack that actually works
You don't need enterprise architecture to start. You need one place where every row represents a feedback event and key fields are standardized.
| Source | Volume | Signal Quality | Collection Effort | Recommended Frequency |
|---|---|---|---|---|
| Surveys | Medium | Medium to high | Low | Weekly |
| Support tickets | High | High | Medium | Daily |
| Sales calls | Low to medium | High | Medium | Weekly |
| Reviews | Medium | High | Low to medium | Weekly |
| Social DMs and comments | Medium | Medium | Medium | Weekly |
| On-site search queries | High | Medium | Low | Daily |
| Refund and cancellation reasons | Low to medium | High | Low | Weekly |
| In-app feedback and usage events | Medium to high | High when paired together | Medium | Daily |
For SMB teams, I usually recommend one of three setups:
- CSV plus Looker Studio if you need a fast start and have low complexity.
- Postgres if you want control and a simple warehouse.
- BigQuery if feedback volume is growing and you'll combine it with analytics data.
Connectors help, but they're optional early on. Manual exports are fine if your process is disciplined.
UserVoice makes a point I strongly agree with: a workflow starts by consolidating all sources into one dataset, applying a consistent taxonomy, weighting by segment or account value, and defining decision thresholds before analysis begins, as outlined in their guidance on customer feedback analysis.
One source of truth beats six “pretty good” dashboards every time.
If you're also mapping these touchpoints against stages like discovery, purchase, onboarding, and renewal, this guide to customer journey mapping is a useful companion. Journey context helps you stop mixing pre-sale objections with post-sale service problems.
First-week setup checklist
- Day 1: List every feedback source and assign an export method.
- Day 2: Define core fields like date, customer ID, source, theme, sentiment, segment, and URL or ticket reference.
- Day 3: Deduplicate records from chat, email, and CRM overlap.
- Day 4: Mask personal data before any text enters an AI or NLP workflow.
- Day 5: Publish a working baseline table and let stakeholders review real examples.
That's enough to get a usable foundation live.
Qualitative and Quantitative Methods Working Together
The fastest way to ruin customer feedback analysis is to force one method to do both jobs.
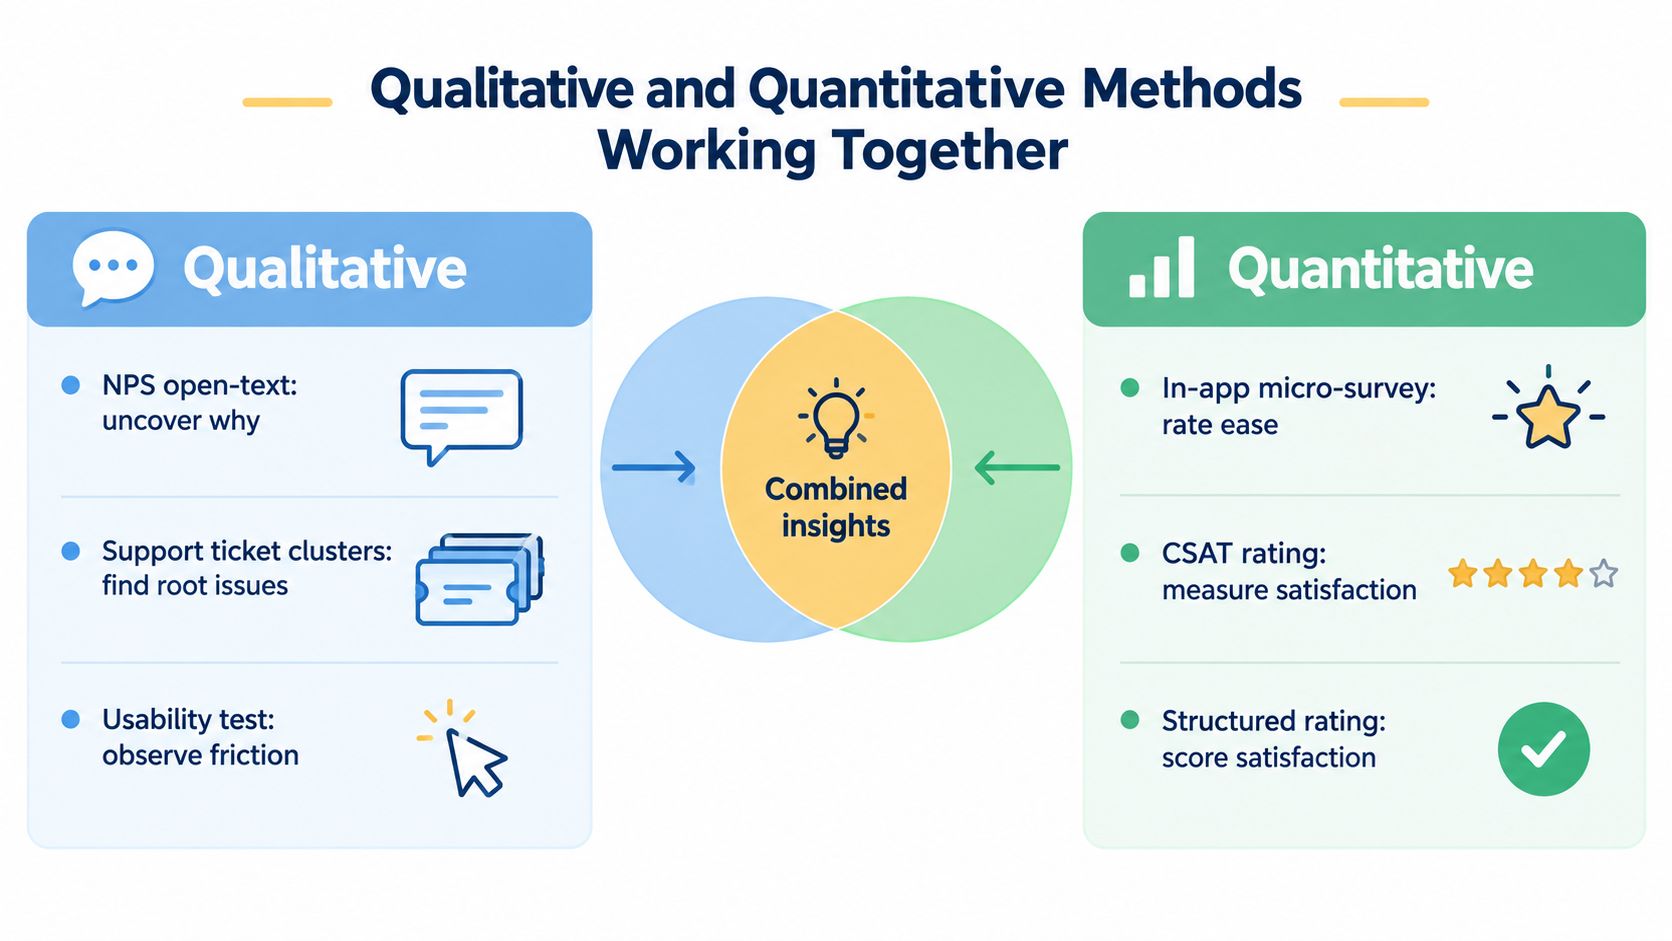
Qualitative methods explain why people are frustrated, delighted, or stuck. Quantitative methods tell you whether the pattern is big enough to prioritize. You need both. Always.
Where each method earns its keep
A customer gives you a low CSAT rating. That's quant. Useful, but shallow. The comment says, “Setup was easy but billing was confusing and support took too long to reply.” That's qual. Now you have direction.
An in-app micro-survey can tell you a new workflow feels hard. Support ticket clusters can reveal exactly where users get stuck. A usability interview can expose the language mismatch on the screen. Funnel drop-off data can confirm whether the issue affects enough users to deserve sprint time.
Here's the rule I use:
- Use quantitative methods to detect shifts, compare cohorts, and track trends over time.
- Use qualitative methods to diagnose causes, uncover wording customers use, and expose issues your scorecards flatten.
- Use both together before you ask product, engineering, or content teams to change priorities.
The common mistake with NPS
Too many teams obsess over the score and ignore the text. That's backward.
The field matured precisely because modern VoC programs combine qualitative inputs like interviews and open-text comments with quantitative inputs like surveys, tickets, and reviews, with the qualitative side explaining the “why” and the quantitative side tracking volume and trends, as described in this VoC overview.
If your NPS program produces one benchmark number and no coded text themes, you don't have a decision system. You have a mood ring.
To ground this in practice, here's a quick explainer worth watching:
A better workflow
Run customer feedback analysis as a triangulation loop:
- Quant flags the problem. Retention weakens for a customer segment, or a product area sees a drop in satisfaction.
- Qual explains the cause. Interviews, ticket themes, and open-text comments identify the friction.
- Quant validates the fix. After you ship the change, structured metrics tell you whether the issue improved.
“Why” without “how many” creates anecdotes. “How many” without “why” creates blind prioritization.
Interviews are worth the effort when the issue is strategic, new, or ambiguous. Structured surveys are better when you already know the main dimensions and need consistent tracking. Don't over-collect verbatims your team won't read. That's one of the easiest ways to turn a useful program into backlog clutter.
Turning Open Text Into Themes You Can Act On
Open text is where the truth usually lives. It's also where teams get overwhelmed.
The solution isn't to read every comment forever. The solution is to build a taxonomy that's stable enough to report on and flexible enough to capture new issues as they appear.
Build a two-layer taxonomy
Start with a fixed parent layer tied to the business. Keep it plain and operational:
- Onboarding
- Pricing
- Billing
- Support
- Performance
- Checkout
- Content quality
- Shipping and delivery
Under each parent, add flexible child tags that emerge from the data. For example, “Checkout” might include promo code confusion, payment failure, mobile form friction, and shipping cost surprise.
Don't overengineer this. You're not building an academic coding framework. You're building a system people can use in sprint planning and weekly reviews.
How to tag without creating chaos
Start manually. Pull a sample of comments from several channels and tag them by hand with product, support, and marketing in the room. You need calibration before automation.
Then scale with model assistance. Keyword rules can handle obvious cases. Embedding-based clustering helps surface patterns you didn't predefine. Topic modeling can reveal themes no one expected, especially in reviews and long survey responses.
What matters most is the output format. I want a theme-by-sentiment matrix that lets each functional lead see their slice quickly.
| Theme | Positive % | Neutral % | Negative % | Volume (30d) | Priority Score |
|---|---|---|---|---|---|
| Onboarding | , | , | , | High | High |
| Pricing | , | , | , | Medium | High |
| Support | , | , | , | High | Medium |
| Performance | , | , | , | Medium | High |
| Billing | , | , | , | Low | Medium |
| Checkout | , | , | , | High | High |
I'm using qualitative labels here because the exact scoring model should match your data maturity and business context.
Sentiment needs more nuance than most tools give you
Sentence-level sentiment matters. A customer can love one part of the experience and hate another in the same comment. If your model labels the whole review “positive” because it starts with praise, your analysis will understate the problem.
That's also why teams should understand the basics of natural language processing before they buy tooling. NLP is useful here, but only when the taxonomy, review process, and validation workflow are set first.
Reality check: AI tagging is only helpful when a human has already decided what “good categorization” means.
You also need a recurring validation habit. Review a small gold set of manually checked examples, compare machine labels against it, and retrain your prompts or models as language shifts. Customer vocabulary changes. Product naming changes. Complaint phrasing changes. Static tagging logic decays faster than teams expect.
The teams that get this right don't aim for perfect interpretation. They aim for consistent interpretation that leads to better decisions.
Automation, AI, and Where Tooling Actually Helps
AI is useful in customer feedback analysis. It's also oversold.
The strongest use case for automation is not “replace your team.” It's remove repetitive work so your team can interpret and prioritize faster. Routing, first-pass tagging, alerting, and summarization all belong here. Final judgment doesn't.
Where AI actually struggles
A 2026 systematic review found that AI-based customer feedback summarization often focuses on sentiment or keyword extraction, misses summaries, and relies on static datasets that don't adapt well to changing feedback trends, while related 2026 research on GenAI in feedback systems flagged low interpretability, delayed decision-making, bias, inconsistency, and open concerns around hallucination, privacy, and adoption barriers in this review paper.
That lines up with what I see in practice. LLM summaries miss sarcasm. They flatten mixed feedback. They often misread feature requests phrased as complaints. They can also behave badly with bilingual or domain-specific language unless you configure them carefully.
If you publish raw LLM-generated themes directly to leadership, you're asking for trust problems.
Tooling by maturity, not hype
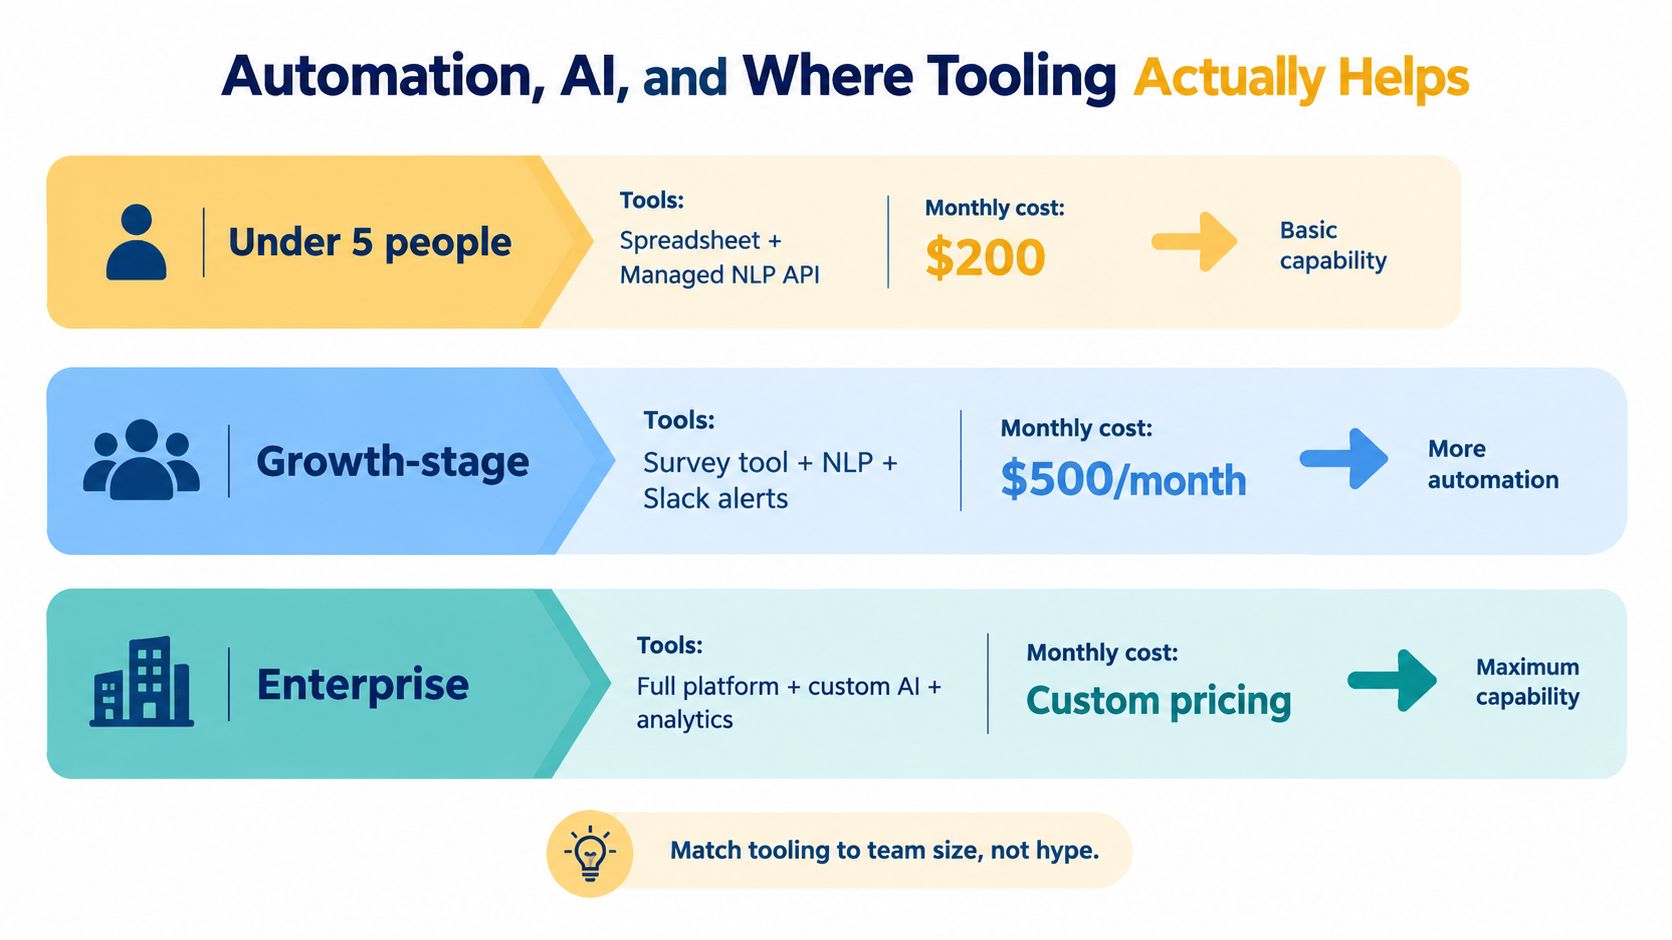
I think about tooling in tiers:
- Tier 1 for very small teams: Spreadsheet plus managed NLP API. Enough for tagging support comments, reviews, and surveys without building a full pipeline.
- Tier 2 for growth-stage teams: A VoC or research platform with integrations, tagging workflows, and dashboards. Dovetail, Qualtrics, and similar tools can work if you keep scope tight.
- Tier 3 for mature programs: Warehouse-native pipelines in BigQuery or Snowflake, custom dashboards, and prompt-controlled summarization jobs with human review.
What matters isn't the category. It's whether the tool fits the team's operating habits.
My opinionated buying criteria
I'd rather see a small business use a modest stack consistently than buy a bloated “AI feedback platform” and barely log in after month two.
Check these before you commit:
- Can it ingest more than survey data?
- Can it export cleanly into your warehouse or reporting layer?
- Can non-analysts review and challenge tags?
- Can it route alerts into tools your team already uses, like Slack or Jira?
- Can you mask sensitive data before model processing?
For companies that need help connecting AI workflows, analytics infrastructure, and website data, Up North Media is one practical option among others. They work across web apps, SEO, and AI consulting, which is the mix many SMB feedback programs need.
Buy tooling that matches your team's review discipline. If no one owns weekly interpretation, the platform won't save you.
The best automation handles the boring parts. Humans should still decide what matters, what gets fixed first, and what deserves customer follow-up.
Designing a KPI Dashboard That Links Feedback to Revenue
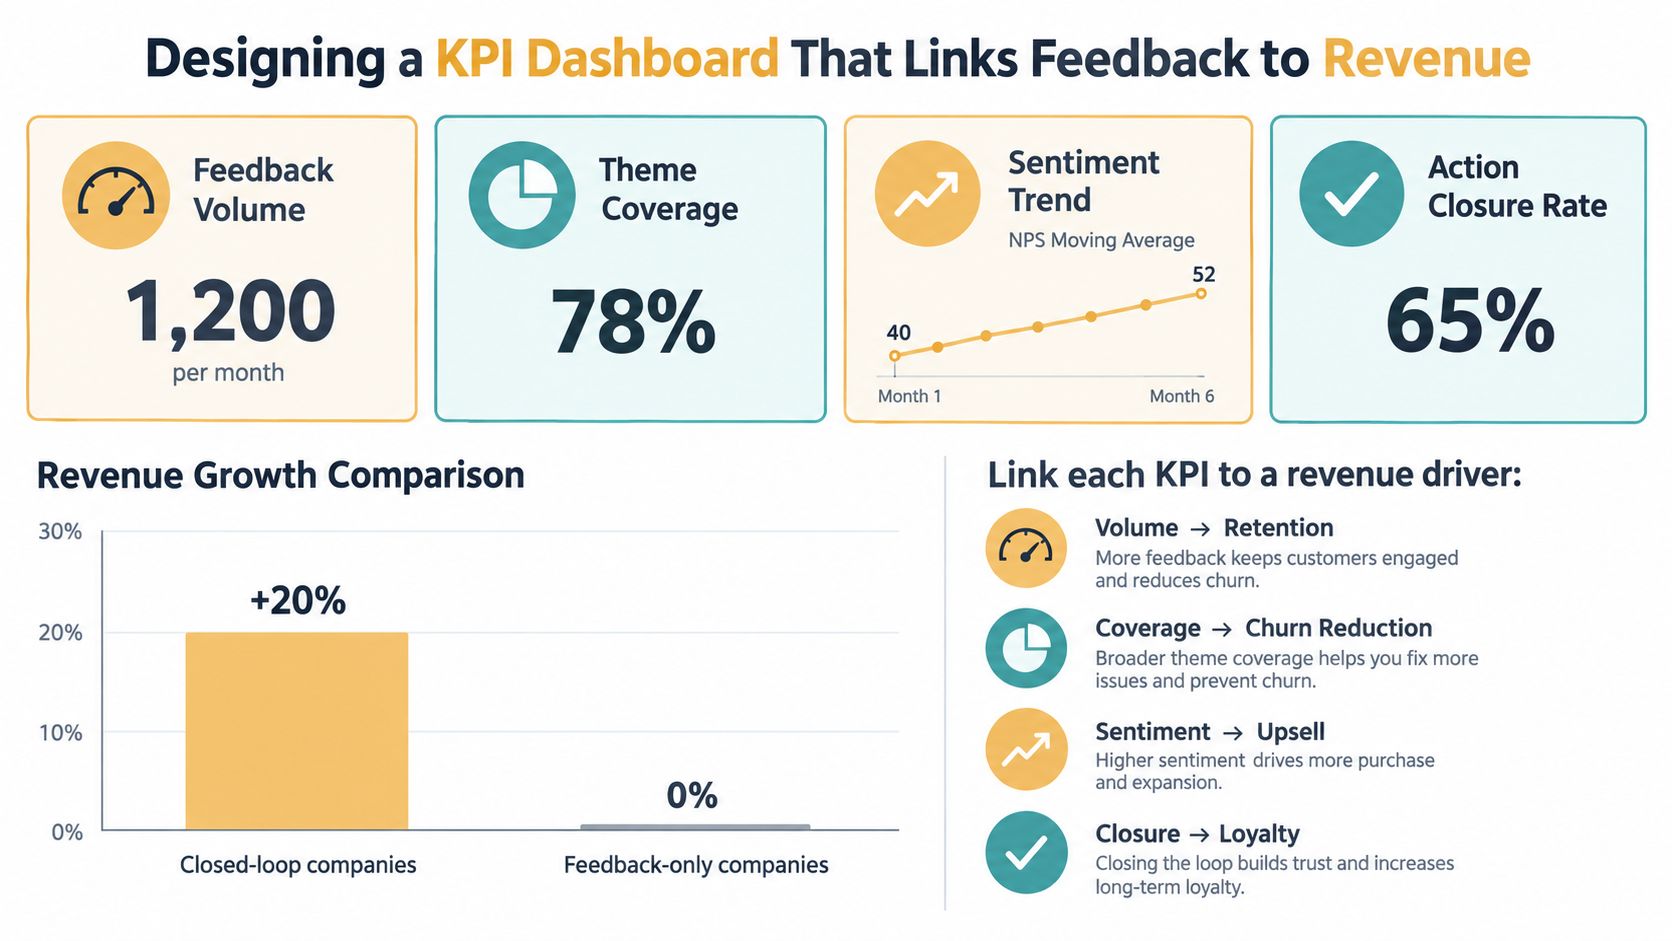
Most feedback dashboards are dead on arrival because they stop at reporting. Leadership doesn't need another sentiment graph. They need to know whether customer pain is concentrated, whether it's getting fixed, and whether it's tied to retention or conversion.
That means your dashboard needs to connect feedback themes to business outcomes.
The four metrics I'd put at the top
Use four north-star metrics that force operational accountability:
- Feedback volume: Are you collecting enough cross-channel input to see patterns at all?
- Theme coverage: How much of incoming feedback has been categorized into your taxonomy?
- Sentiment trend: Are priority themes improving or deteriorating over time?
- Action closure rate: Are high-priority issues being resolved and communicated back?
I care less about making these tiles look polished and more about whether each one can drive a weekly decision.
Build the bridge to business metrics
This is the part teams skip. Each feedback theme needs a relationship to something commercial.
For example:
| Feedback theme | Product or journey area | Business metric connection | Likely owner |
|---|---|---|---|
| Checkout confusion | Conversion flow | Cart completion and revenue capture | E-commerce lead |
| Billing complaints | Account management | Renewal risk and support load | Finance and CX |
| Onboarding friction | Activation | Trial-to-paid or adoption quality | Product |
| Content mismatch | SEO landing pages | Bounce behavior and assisted conversion | SEO lead |
| Shipping complaints | Fulfillment | Repeat purchase risk | Ops |
Once you do this, the dashboard stops being a listening artifact and becomes a prioritization tool.
A strong analytics implementation matters here because your feedback dataset must connect to product usage, revenue, CRM, and retention views. This overview of analytics implementation is relevant if your current reporting stack can't tie those systems together cleanly.
What good dashboard behavior looks like
I prefer a small-multiples layout by theme. Each major theme gets its own panel with trendline, recent verbatims, current volume, and open action status. That structure keeps teams from hiding behind aggregate averages.
Then add alert logic. Not dozens of alerts. One meaningful one per theme. If “checkout confusion” spikes or sentiment around “billing” worsens, the owner should know immediately.
A dashboard should assign work, not just summarize history.
Don't refresh everything at the same cadence. Operational views can update daily. Trend review is usually fine weekly. Executive rollups should focus on shipped actions and outcome movement, not raw feedback noise.
If your dashboard can't answer “what changed because of this?” it isn't finished.
From Insights to Action With a 90-Day Rollout Plan
Teams that act on feedback quickly keep customers. Teams that collect feedback without an operating model create a backlog, a reporting ritual, and very little change.
The first 90 days should build one thing: a working pipeline from signal to owner to shipped fix. Treat this as an ops rollout, not a research project. If feedback stays trapped in surveys, support tickets, app reviews, and call notes, nothing moves. Small and mid-sized teams win by unifying those sources into one decision layer, then forcing a weekly action cadence around it.
A simple example makes the point. If “checkout confusion” shows up in support chats, review text, session notes, and refund reasons, that is not a CX theme to admire. It is an execution problem with clear owners. Product tests the page structure. Content rewrites the help article. Marketing tightens pre-purchase messaging so buyers arrive with the right expectations.
Days 1 through 30
Set up the minimum system that lets you review one version of the truth every week.
- Consolidate source inputs: Pull surveys, reviews, support logs, on-site search, chat transcripts, and refund reasons into one working dataset.
- Create a practical taxonomy: Start with business-ready themes such as onboarding friction, pricing confusion, checkout issues, shipping delays, and feature gaps.
- Publish the first working view: It can be plain. It must show themes, volume, recency, owner, and status.
- Assign one program owner: One person runs intake, theme hygiene, and the weekly review. Without that owner, the pipeline stalls fast.
Do not wait for a perfect schema. You need enough structure to route decisions, not a six-week taxonomy exercise.
Days 31 through 60
Now add the operating documents that turn analysis into action.
Build three standard artifacts:
- Insight memo: One page. Theme, evidence, affected segment, business impact, recommended action, owner.
- Action brief: The document the functional team uses to ship the fix, whether that team sits in product, lifecycle, SEO, support, or ops.
- Outcome review: A short record of what changed, what shipped, and what happened after release.
This is also the right point to automate handoffs. Route tagged billing issues to finance or CX. Send product defects into Jira. Push recurring fulfillment complaints to ops. Push review themes into a Slack channel if the team uses that channel to assign work. Skip clever automation that creates noise. Good tooling moves issues into the queue where someone already works.
Days 61 through 90
By this stage, the feedback program should produce fewer observations and more decisions.
Focus on three checks:
- Measure post-launch effect: Did complaint volume drop, conversion improve, activation friction ease, or retention risk fall for the affected segment?
- Cut low-value collection: If a form or survey generates vague comments with no action path, remove it.
- Lock the review cadence: Weekly operating review. Monthly leadership review. Quarterly taxonomy cleanup.
Response rates alone are a weak foundation for a program. External benchmark reporting shows many surveys get limited participation, which is exactly why teams should not rely on survey data as the main input. Use surveys, but combine them with behavioral data, support conversations, reviews, and operational events. The follow-through matters more than the form.
Customer feedback analysis works best as a decision pipeline. It collects fragmented signals, standardizes them, routes them to owners, and checks whether the fix changed revenue, retention, or friction.
A two-person team can run this well. One owns intake, tagging, and QA. One owns routing, follow-up, and stakeholder pressure. That is enough if the system is tight and the review cadence is real.
Up North Media helps SMB teams turn scattered customer feedback into a usable decision layer by connecting analytics, SEO, web experience, and AI workflows. If you need help building the pipeline, not just launching another survey, visit Up North Media.