

The traffic chart is up, your latest article is getting attention, and the marketing report looks healthy. Then someone asks whether any of those visitors became customers. Nobody has a clear answer, so the meeting drifts back to rankings and pageviews.
Stop Treating Pageviews as Proof of Performance
A traffic spike is worth investigating, not automatically celebrating. If your team can't connect it to qualified leads, purchases, or an audience that returns, you know the content attracted visits. You don't yet know whether it did its job.
That's the starting point for how to measure content performance: separate evidence of attention from evidence of business value. Don't ask a traffic report to answer questions it wasn't designed to answer.
Separate consumption, influence, and impact
Your measurement system needs to distinguish these questions:
- Consumption: Did people actually engage with the article, video, or guide?
- Influence: Did that interaction help them take a meaningful next step?
- Incremental results: Did the content produce an outcome that wouldn't otherwise have happened?
Those distinctions matter because the same traffic total means different things to different businesses. A publisher might value readers who return and subscribe. An e-commerce retailer needs to understand whether visitors discover products and buy. A B2B service firm needs prospects who fit its services, not just people who enjoy its advice.
A useful article can succeed at consumption without succeeding at conversion. That doesn't make it worthless. It means the team needs to judge it against its intended role rather than retrofit a success story around whichever chart went up.
The problem isn't just your dashboard
In Content Marketing Institute's enterprise research for 2025, only 48% of enterprise marketers said they measured content performance effectively; 66% struggled to track customer journeys, 63% struggled to attribute ROI, and 49% couldn't connect performance to business goals, while B2B marketers reported 56% difficulty with both ROI attribution and journey tracking.
A dashboard can accurately count activity while leaving the business question unanswered.
Buying another reporting tool won't settle that question by itself. Start with agreed goals, make the necessary actions measurable, calculate comparable outcomes, distinguish attribution from causation, assign ownership, and test the decisions that matter.
That's less exciting than a traffic victory lap. It's also a better basis for deciding what to publish next.
Define Content Goals and KPIs First
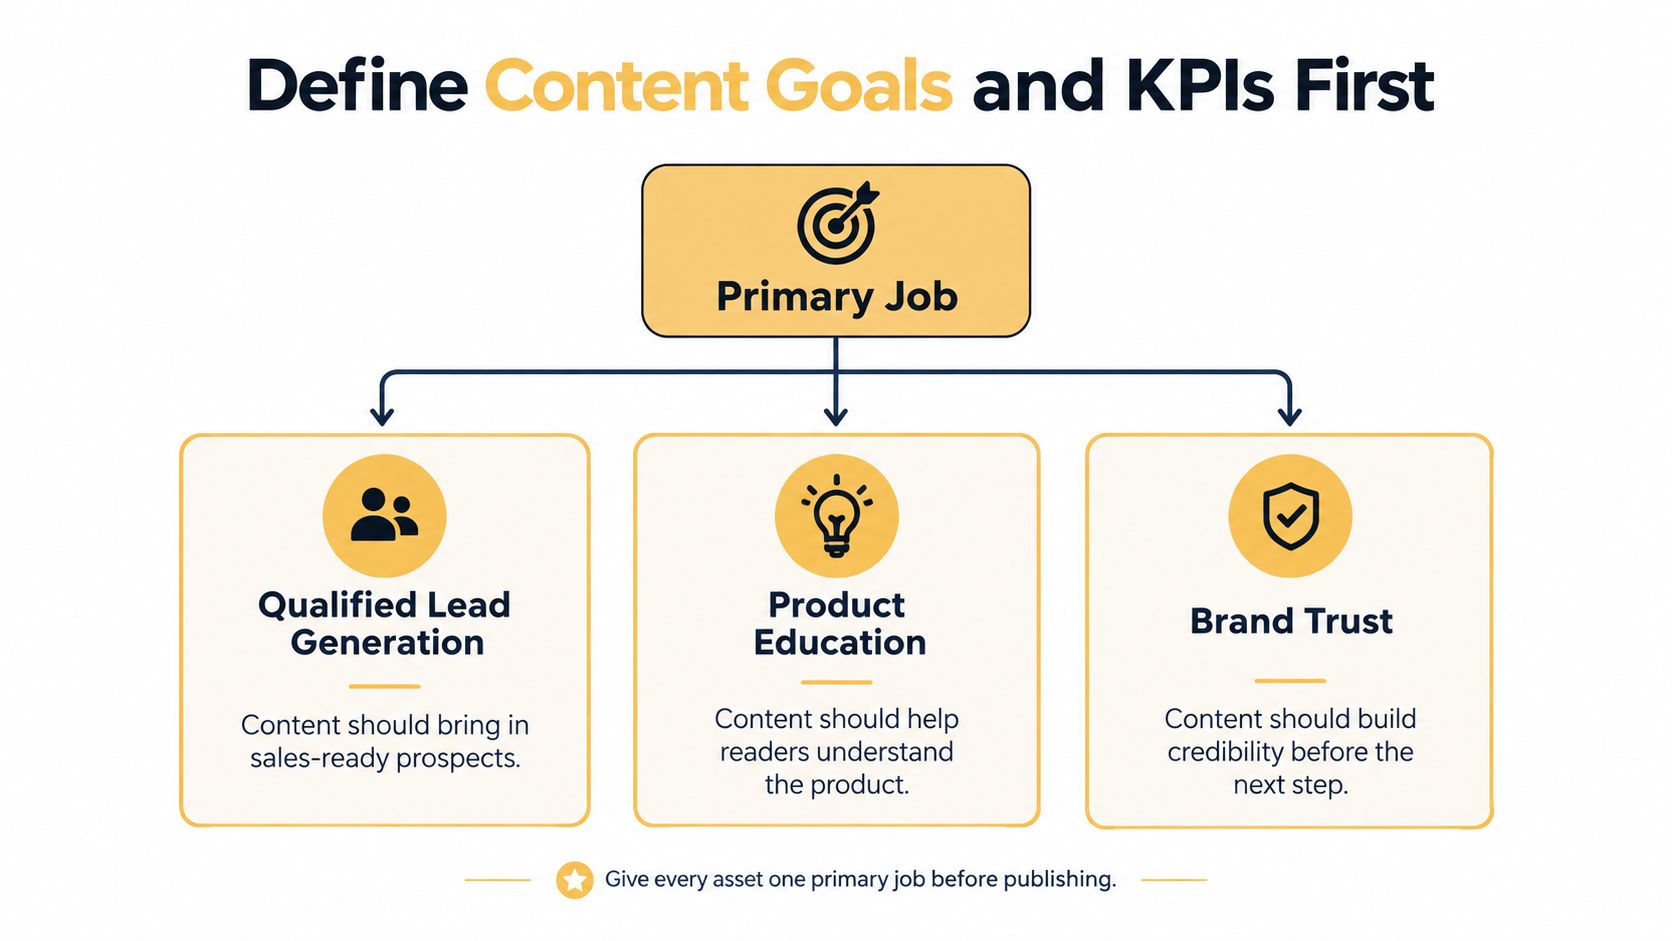
Give every asset one primary job before publishing. A buying guide might support product discovery, a service comparison might generate qualified inquiries, and an educational article might build familiarity before someone is ready to contact you.
Secondary benefits are welcome. They shouldn't let your team change the definition of success after seeing the results.
Use this hierarchy to keep the asset's job visible.
Build a hierarchy rather than a blended score
Keep different kinds of evidence separate:
- Content signals describe attention and consumption, including impressions, organic visits, shares, watch time, and engagement rate.
- Channel KPIs show whether the channel contributes useful actions, such as subscriber growth, qualified leads, and conversions.
- Business outcomes establish commercial relevance through pipeline, customer acquisition cost, revenue, and retention.
Don't combine those into an opaque performance score. A heavily shared article with weak lead quality shouldn't look commercially successful just because the share count offsets poor downstream results.
Leading indicators help you diagnose progress before the final outcome arrives. Engaged sessions, time in focus, and repeat visits belong here. Lagging indicators, including qualified leads, purchases, and revenue, establish whether the intended outcome materialized.
Write a brief someone can evaluate
Attach a short KPI brief to the content assignment. Include the audience, primary objective, desired action, qualification criteria, baseline, target, reporting window, and person responsible for the decision.
An explicit target might be a 10% increase in qualified leads or a 20% increase in lead-form completions, examples used in Content Marketing Institute's measurement framework. Those are planning examples, not benchmarks to copy without considering your baseline.
Define what qualifies before setting the target. For an Omaha service business, that might mean an inquiry from someone in the service area requesting work the company provides. A completed form from a vendor pitching software doesn't meet that standard.
Choose a review cadence that fits the outcome. Check tracking promptly after launch, but give a considered purchase enough time to develop before judging commercial performance.
The brief should also state the decision the report will support: expand the topic, improve the offer, change distribution, or stop investing. If nobody knows what they'll do with a metric, it probably doesn't belong in the primary scorecard.
Set Up GA4 Search Console and Event Tracking
Treat your measurement tools as complementary, not interchangeable. Use GA4 for on-site sessions, engagement, and key events; Search Console for search queries, impressions, and landing-page demand; and product or event tracking for the actions between arrival and the business outcome.
A product-page visit, useful download, successful inquiry, and completed purchase shouldn't all disappear into a generic interaction category. You need enough detail to identify where people progress and where they stop.
Make the intended action collectable
Translate the primary objective into a clearly named key event. For lead generation, distinguish a successful submission from a click on the submit button. For commerce, confirm the purchase against the order record rather than assuming a checkout-page view means someone paid.
If you're publishing through VeloCMS, its instructions to add GA4 tracking to a blog provide a practical installation starting point. Installing the tag is only the beginning; validate the business events separately.
Run through the intended journey yourself. Confirm that the event fires on success, doesn't fire on failure, and doesn't duplicate when someone refreshes the confirmation page. Record what each event means so another marketer can interpret it without guessing.
Protect the comparisons
Before launch, establish the controls that make later reporting usable:
- Campaign naming: Apply consistent UTM conventions so email, paid social, and other campaigns don't fragment into accidental categories.
- Journey continuity: Check cross-domain tracking when users move between the website, checkout, or another conversion system.
- Collection rules: Document consent handling, deduplication, and exclusions for internal or suspicious traffic.
- Reporting segments: Preserve acquisition source, device, geography, new versus returning users, and content cohort.
Use an analytics implementation checklist to organize the technical work rather than relying on someone's memory of how the tags were configured.
Keep a pre-publication baseline and record the audience, source, and comparison window. Separate paid promotion from organic discovery, and avoid grouping newly published articles with mature pages without labeling the difference.
Finally, reconcile analytics with operational records. If your forms system records successful inquiries that never appear in analytics, investigate the gap before judging the article. More elaborate reporting won't repair incomplete collection.
Calculate Traffic Engagement and Conversion Metrics
Start with the definitions, then choose denominators that match the question. An impressive-looking rate isn't useful if different people calculate it differently.
Under Google Analytics' engagement definitions, an engaged session lasts longer than 10 seconds, includes at least one conversion event, or records at least two page or screen views; engagement rate is engaged sessions divided by total sessions, and bounce rate is the share of sessions that weren't engaged.
That makes engagement more informative than visits alone, but it still isn't a verdict on usefulness.
Content Performance Scorecard
| Question | Metric | How to read it | Do not confuse it with |
|---|---|---|---|
| Did visitors engage? | Engagement rate | Engaged sessions ÷ total sessions | Proof they understood or valued the content |
| Did readers progress? | Content-to-next-step rate | Content visitors taking the defined next step ÷ eligible content visitors | Any click, regardless of destination |
| Were inquiries useful? | Lead qualification rate | Qualified leads ÷ submitted leads | Form volume |
| Did the cohort convert? | Conversion rate | Converting users ÷ eligible users in the cohort | A session-based rate with a different denominator |
| What commercial value followed? | Revenue per visitor | Recorded cohort revenue ÷ cohort visitors | Profit or incremental revenue |
| How long did the decision take? | Time to conversion | Elapsed time from the defined starting interaction to conversion | Evidence that the first interaction caused the sale |
| Did people come back? | Returning-user rate | Returning users ÷ total users in the defined period | A complete count of cross-device relationships |
These are working definitions for your scorecard. Document eligibility, conversion windows, and whether a metric counts people, sessions, or events. Don't switch denominators between reports.
As an illustrative comparison, 100,000 low-engagement visits may be less useful than 10,000 visits producing sustained reading, further page views, or conversions, consistent with the engagement distinction above. The larger audience wins on reach, not necessarily on value.
Match the scorecard to the business
For retailers, connect reach to product views, add-to-cart actions, purchases, and revenue. A buying guide that attracts visitors but rarely moves them toward a relevant product needs a different response from one that generates carts but loses buyers during checkout.
For publishers, prioritize engaged sessions, average engagement time, meaningful scroll or video completion, newsletter registrations, and returning readers. Define completion carefully so a superficial interaction doesn't qualify as meaningful consumption.
For service firms, carry inquiries through qualification and sales outcomes. Otherwise, an increase in unsuitable submissions can look like progress.
When choosing tools for measuring customer engagement, start with the behavior you need to observe. Then organize the chosen measures in a Google Analytics KPI dashboard that preserves those definitions and comparisons.
Reporting rule: Show the denominator and the downstream outcome beside the headline rate.
Measure Content Influence Beyond Last Click
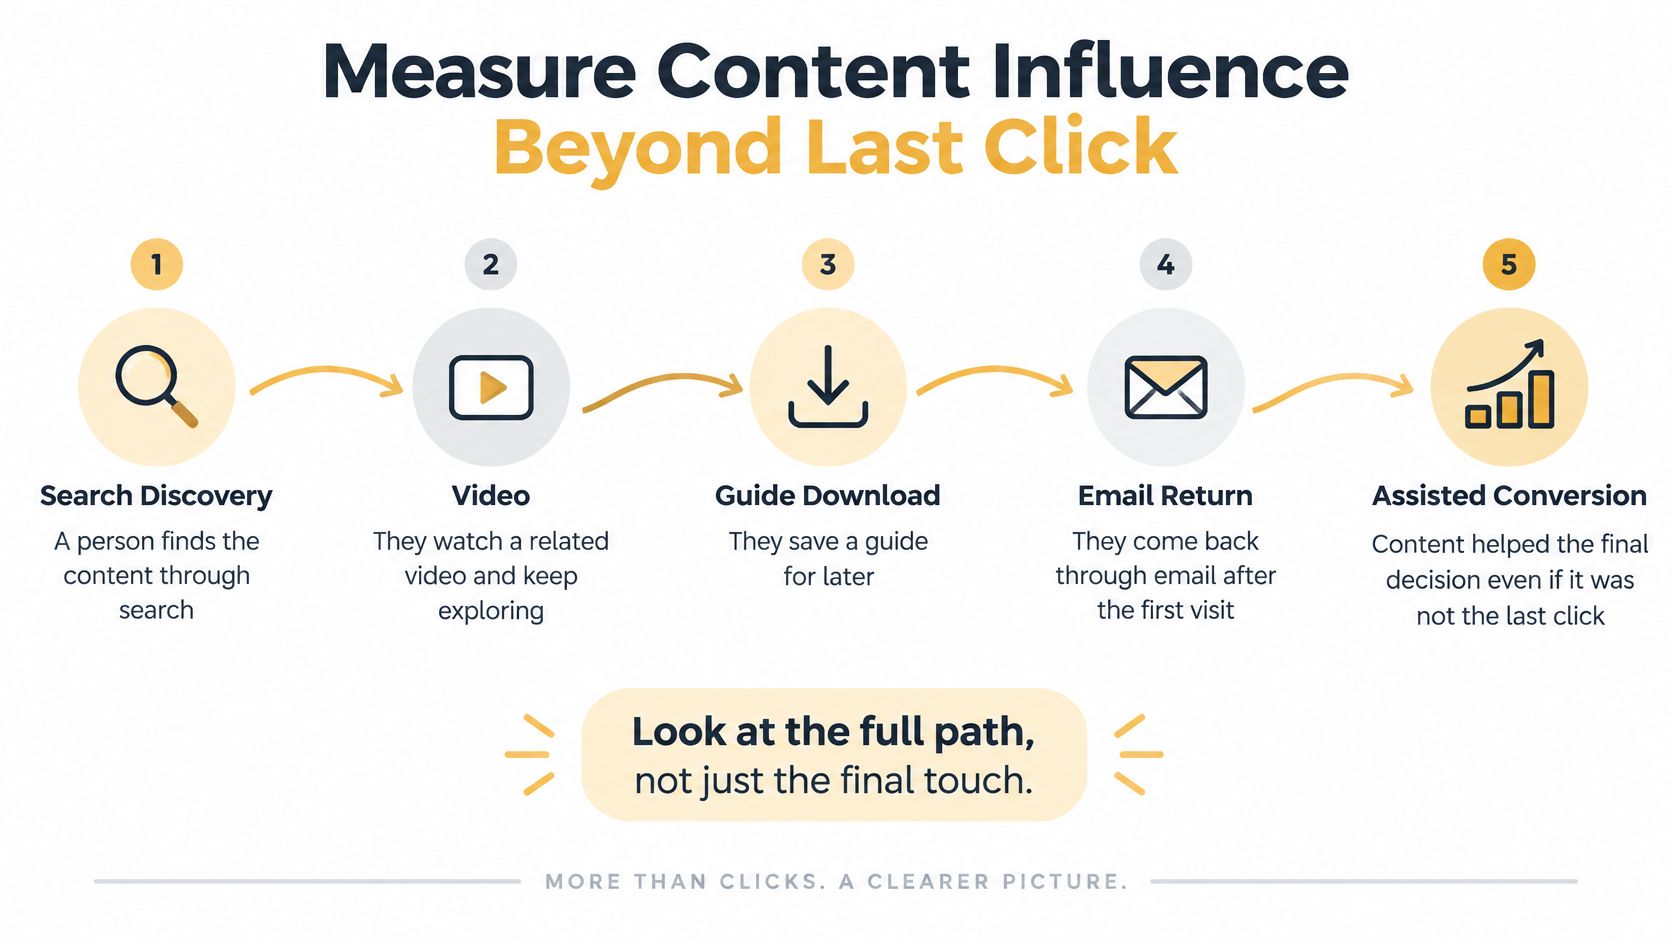
Consider a plausible customer journey: someone discovers an article through search, watches a related video, downloads a guide, returns through email, and finally speaks with sales. A last-touch report might credit the final visit without describing the earlier work.
The path below illustrates why content-assisted reporting belongs beside last-touch reporting.
Report influence without calling it causation
Assisted conversions identify conversions with an earlier observed content interaction. They help answer whether content appeared along the recorded path, not whether the customer would have converted without it.
Use a marketing attribution framework to define how your reports allocate credit. Add context through pipeline velocity, repeat purchases, and self-reported discovery, while recognizing that customer recollection is also incomplete.
Attribution models distribute credit among observed touchpoints. They can't capture every offline conversation, cross-device visit, or untracked interaction. A more complicated model doesn't automatically provide stronger causal evidence.
Use this video as a companion to the distinction between recorded journeys and business impact.
Account for exposure without a visit
For AI answers, maintain a separate record of observed citations and mentions across a defined set of relevant questions. Record the question, date, answer context, and cited page rather than turning occasional sightings into a claim about total audience reach.
OGTool's discussion of how brands earn AI citations is a relevant resource for shaping that measurement brief. Compare observed visibility with branded-search and direct-traffic movement, but don't treat simultaneous changes as proof of influence.
Test the counterfactual
For awareness content, compare exposed and control audiences using aided recall, familiarity, favorability, and purchase intent. Nielsen's emerging-media analysis reports average aided recall of 81% for branded content, 79% for influencer marketing, and 71% for podcasts, with familiarity gains of approximately 5 points for branded content and influencer marketing and 3 points for podcasts.
Those are contextual findings, not targets for your campaign.
Holdouts, geo-experiments, and matched-market tests can provide stronger incrementality evidence when designed appropriately. Report sample size, confidence intervals, exclusions, and limitations.
The reporting pair should be explicit: what the attribution model credited and what the incrementality evidence supports. Don't merge them into a single certainty claim.
Choose the Right Measurement Approach
The right operating model depends on the decisions at stake and who can maintain the system. A founder doesn't need an elaborate reporting operation to evaluate a straightforward inquiry path. A retailer with separate publishing, checkout, and customer systems may need more technical ownership.
Use this comparison to identify where your current setup fits.

Founder-led measurement
A founder using GA4 and Search Console can keep the scorecard focused and close to actual customer conversations. That's useful when someone can personally verify whether inquiries were suitable and whether purchases were genuine.
The trade-off is time and maintenance. If tagging, reporting, and qualification depend on the founder remembering to do them, comparisons become harder to trust during busy periods.
Choose this approach when the journey is straightforward and the reporting burden remains manageable. Don't buy complexity merely to make the dashboard look more professional.
In-house connected reporting
An in-house marketer can join analytics to CRM records, maintain qualification definitions, and follow content cohorts through the sales process. The advantage is operational proximity: the marketer can ask sales why an inquiry was rejected or why an opportunity stalled.
The weak point is ownership across departments. Marketing may control campaign tags while sales controls lead stages and a developer controls checkout events.
- Assign responsibility: Name who maintains event definitions, CRM stages, and reconciliation.
- Protect continuity: Keep documentation accessible when staff or vendors change.
- Reserve analysis time: Building reports isn't the same as interpreting them and making decisions.
Agency-supported measurement
An external partner makes sense when the missing capability crosses analytics, development, and marketing. Look for someone who can fix collection and conversion paths, not merely decorate exports.
An Omaha digital agency combining custom web applications, data-driven SEO, and AI consulting fits that kind of assignment. SEO work addresses demand and content relevance, web development addresses the conversion journey, and automation can reduce repetitive reporting work.
External support still needs an internal decision-maker. Nobody outside the business can independently define a commercially useful lead or settle competing growth priorities.
Choose the lightest system that can support a decision you're actually prepared to make.
For a small business, a false positive can mean funding the wrong topic while neglecting a useful one. Judge the setup by whether it reduces that risk, not by the number of charts delivered.
Test Improve and Take the Next Step
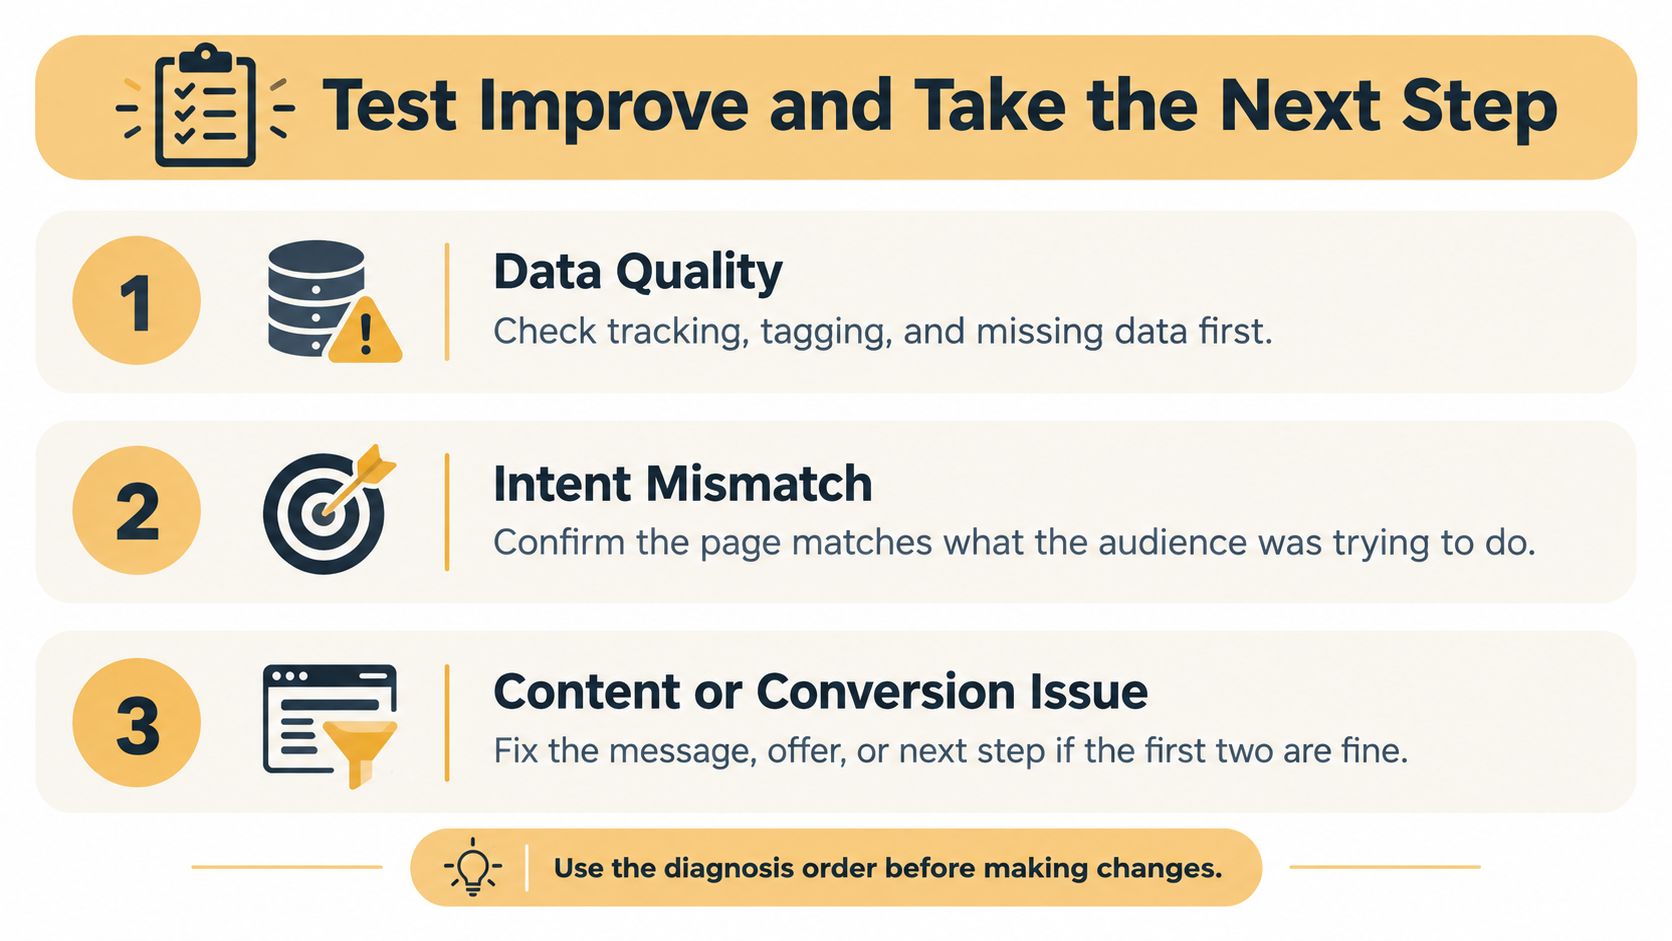
When a page underperforms, don't start by rewriting its introduction. Diagnose the problem in an order that prevents unnecessary content work.
Use this checklist before changing the page.
Diagnose before editing
- Data quality: Check whether the apparent decline reflects broken collection, changed definitions, or incomplete records.
- Intent mismatch: Confirm that visitors want what the page provides. Someone researching a process isn't necessarily ready to request a quote.
- Content or conversion friction: If collection and intent are sound, examine clarity, evidence, the offer, and the next step.
Include nonconverters in the analysis to avoid survivorship bias. Account for seasonality, don't over-credit the final touch, and don't treat platform impressions as unique people.
AI search makes the diagnosis more complicated. The cited 2025 search and retail findings describe an analysis of 300,000 keywords in which top-ranking pages reportedly experienced a 34.5% average CTR decline when an AI Overview appeared; Adobe's cited March 2025 US retail data showed AI referrals with 8% higher engagement, 12% more pages per visit, and 23% lower bounce rate, but 9% lower conversion than other traffic.
Those findings describe different measures and contexts, not a universal forecast. Track identifiable AI referrals separately, including returning users and revenue per visitor. The appropriate response may be stronger trust signals or a better landing path, not chasing more clicks.
Set the test rules in advance
Write a specific hypothesis and choose a primary metric. Before launch, define the minimum detectable effect, test duration, and stopping rule; don't crown a winner because an early check looks encouraging.
Use randomized A/B testing where feasible. When the question concerns incrementality rather than page preference, use the controlled approaches described earlier and acknowledge uncertainty.
This week, draft the scorecard for a priority URL. Record its job, qualifying action, baseline, denominator, comparison window, and the decision you'll make from the results. If you can't reliably collect those inputs, fix the measurement before commissioning more content.
Up North Media offers custom web development, data-driven SEO, and AI consulting to connect content activity with measurable business outcomes. Visit Up North Media to book a free consultation if your events, CRM, and reporting need to work together before you can trust the next performance review.