
A Stanford study found that more than 70% of U.S. manufacturing plants already used at least some predictive analytics in 2010, rising to 80% by 2015. Adopters recorded productivity levels approximately 1% to 3% higher than comparable non-adopters, a difference associated with roughly $464,000 to more than $918,000 in additional sales for the average plant. The study doesn't prove predictive analytics caused every gain, but it does challenge the idea that forecasting is a recent experiment reserved for large technology companies. Stanford's study shows that predictive methods have been part of serious operational decision-making for years.
A smaller business can still feel far behind. The owner has dashboards for sales, traffic, advertising, and customers, yet the team spends Monday reacting to what went wrong last week. Inventory runs short before a promotion, a publisher assigns resources after traffic has already peaked, and a local service discovers an overloaded schedule when customers are already waiting.
Predictive analytics for business changes the timing of that work. It uses historical data to estimate a specific future outcome, then connects that estimate to a decision someone can make before the opportunity or problem passes.
What Predictive Analytics Actually Does for a Business
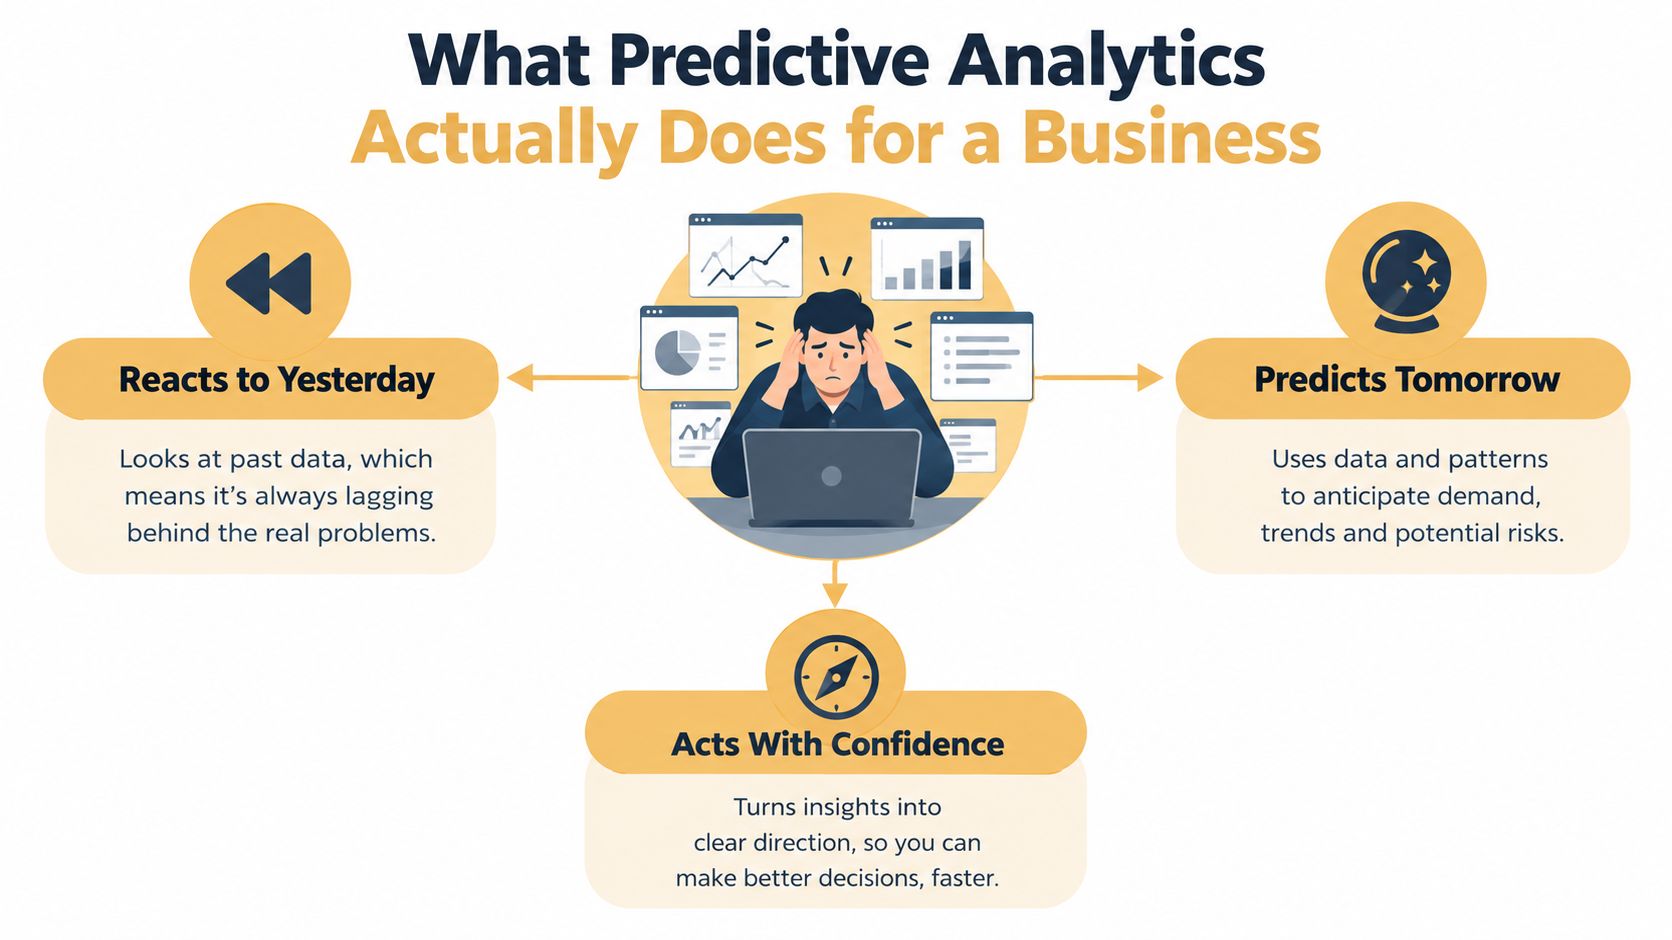
A dashboard tells a retailer what sold yesterday. Predictive analytics estimates what is likely to sell next week, by product and channel, so the buyer can place an order or adjust a promotion before stock becomes a problem. A customer report shows who canceled last month. A churn model identifies current customers whose behavior resembles earlier cancellations, giving the service team a reason to intervene while retention is still possible.
That distinction matters. Descriptive reporting explains what happened. Predictive analytics estimates what may happen next. Gut feel can still contribute local knowledge, but a forecast makes the assumptions visible and testable. The useful question isn't whether a model can produce an impressive score. It's whether the score changes a decision, such as how much inventory to hold, which leads to call, or how many people to schedule.
Forecasting instead of reporting
A practical predictive system connects four parts:
- A defined outcome: Demand, churn, qualified leads, appointment volume, or another measurable event.
- Relevant historical signals: Transactions, customer interactions, seasonality, marketing activity, or operational records.
- A forecast or probability: An estimate accompanied by enough context for a person to judge it.
- A decision rule: The action taken when the estimate crosses a useful threshold.
That last part gets neglected. A forecast that sits in a dashboard without an owner is just another report. The model earns its keep when it reaches a buyer, salesperson, editor, scheduler, or operator at the point where they can act.
Predictive analytics has also moved well beyond factory planning. It now supports demand forecasting, fraud detection, customer retention, sales prediction, equipment maintenance, and workforce planning. For organizations exploring financial risk and customer behavior, a focused overview of predictive analytics in banking can provide useful industry context without changing the underlying implementation discipline.
What it can't promise
A model can't see events that have no useful signal in the available data. It can't repair a broken product catalog, settle conflicting customer definitions, or guarantee that a sales team will follow its recommendations. It can also be wrong when markets shift, promotions change behavior, or a data feed stops updating without notice.
The right expectation is better-timed decisions under uncertainty, not certainty. Businesses should treat a prediction as decision support, measure what happened afterward, and give people a clear way to challenge or override it.
Where Predictive Analytics Earns Its Keep
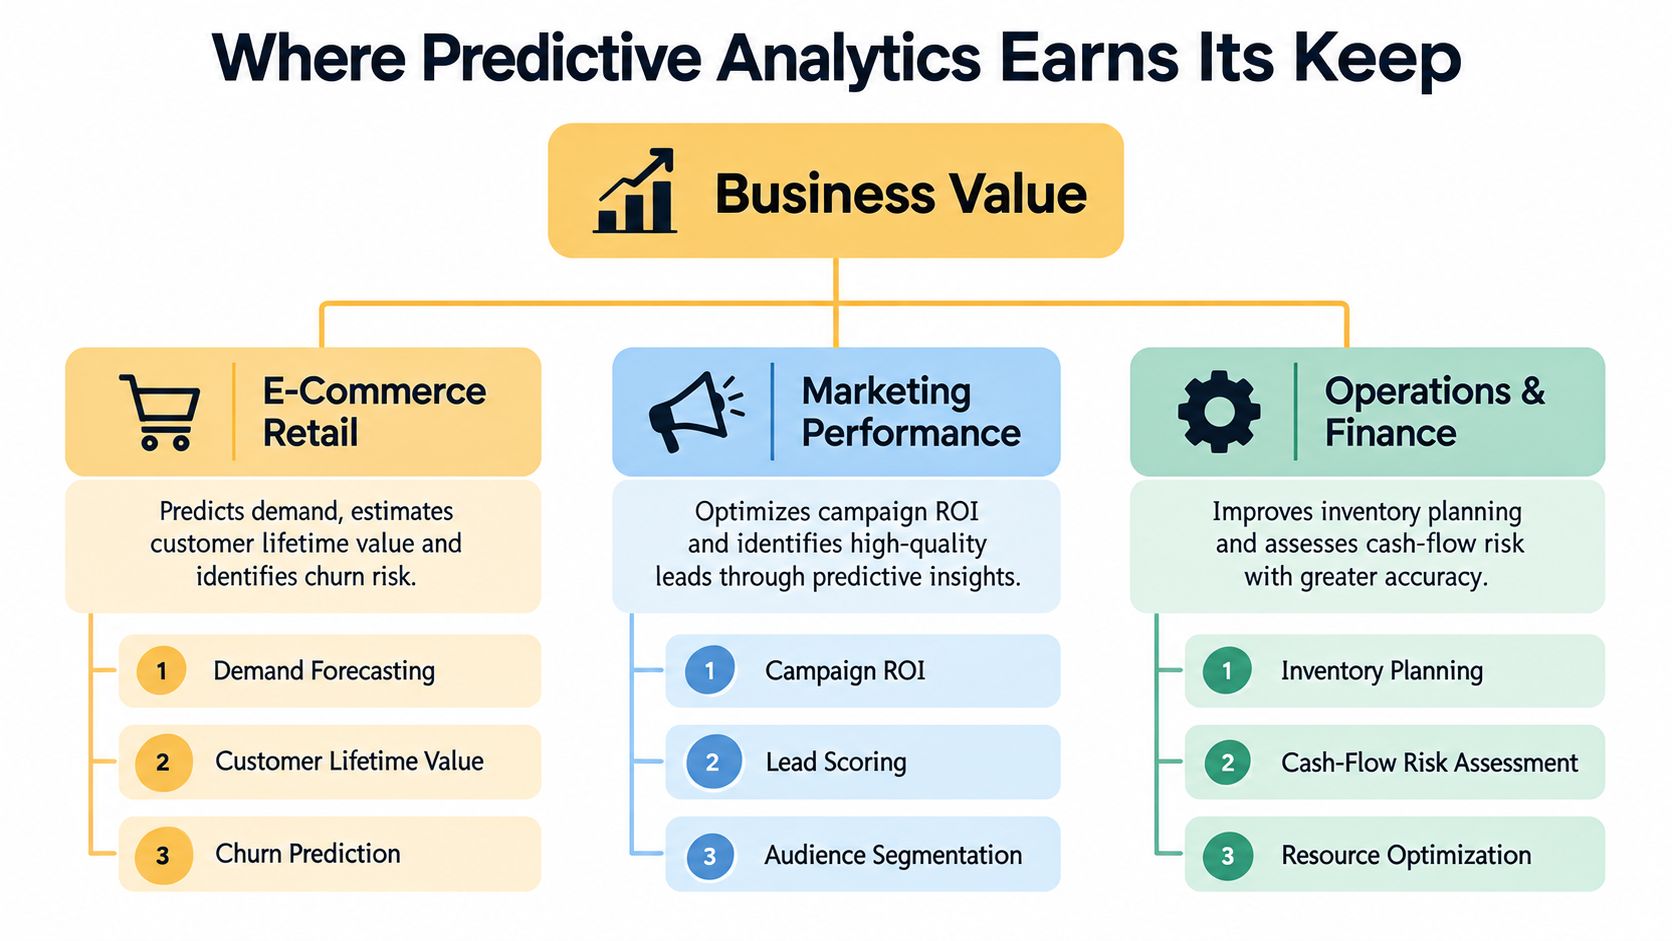
The strongest use cases are narrow. A retailer doesn't need to “predict the business” in the abstract. It needs to estimate demand for a product group, identify customers likely to stop buying, or decide which replenishment problem deserves attention today.
E-commerce retailers
Demand forecasting is often the clearest starting point. Historical orders, returns, promotions, price changes, product availability, and calendar effects can help estimate future demand. The decision is usually operational, such as when to reorder, where to allocate inventory, or whether a promotion will create a stockout.
Customer lifetime value and churn prediction answer a different question. Which customers are likely to buy again, and which ones are showing signs of disengagement? The model needs dependable customer identity, order history, recency, frequency, product mix, and engagement signals. The business metric isn't model accuracy in isolation. It might be repeat-purchase contribution margin, retained revenue, or the cost of an incentive.
Recommendations can be valuable when the catalog and behavioral data are consistent. They should improve product discovery or basket value, but a recommendation engine that surfaces unavailable, low-margin, or irrelevant products creates work rather than value.
Publishers and content platforms
A publisher can forecast traffic by content type, channel, or audience segment and use that estimate for editorial planning, sales capacity, and infrastructure decisions. Content performance prediction may help prioritize topics or formats, but it shouldn't replace editorial judgment. Historical engagement can favor familiar subjects and suppress useful experiments.
Lead scoring works when it changes sales prioritization. Useful inputs might include content engagement, firmographic details, form activity, and source quality. The output should reach the CRM with a clear explanation of what the sales representative should do next. A score that isn't connected to a handoff process won't improve pipeline quality.
Local services
Appointment forecasting helps a clinic, repair company, studio, or professional practice plan capacity around expected demand. The useful decision may involve staffing, opening additional availability, or managing a waitlist. Retention models can highlight customers who haven't returned when their normal service pattern suggests they may be drifting away.
Founder test: Predict the smallest decision that, if answered faster, would change the next quarter.
For each candidate, write down the action, required data, owner, and business metric before selecting a model. The worldwide predictive analytics market was estimated at $18.9 billion in 2024 and projected to reach $82.3 billion by 2030, with a projected 28.3% compound annual growth rate from 2025 through 2030. North America represented 33.4% of global revenue in 2024 in that estimate, according to Grand View Research's market analysis. Market growth doesn't tell a small business what to build, but it does reflect how broadly these use cases are being adopted.
How Predictive Analytics Works from Data to Decision
A dependable workflow starts with a business question, not an algorithm. “Can we use AI?” is too vague to test. “Can we estimate next week's appointment demand by location well enough to improve staffing?” gives the team an outcome, a horizon, a segment, and a decision.
The working pipeline
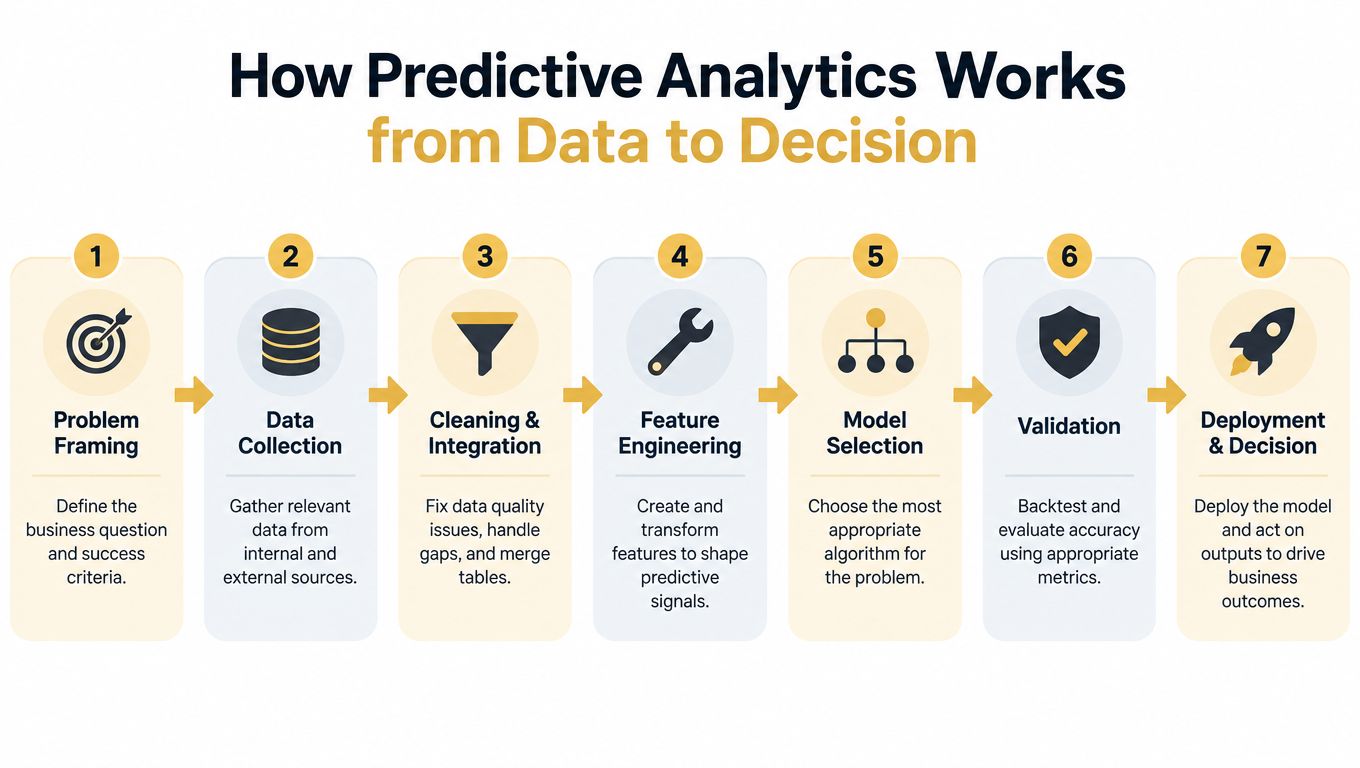
- Problem framing: Define the target, forecast horizon, audience, and action. The business owner decides what outcome matters and what an acceptable error would cost.
- Data collection: Gather the systems that contain relevant history, such as a CRM, ecommerce platform, scheduling tool, advertising account, or inventory file.
- Cleaning and integration: Resolve duplicate records, inconsistent names, missing dates, timezone issues, and conflicting definitions. Analysts and system owners usually find the most important problems during this phase.
- Feature engineering: Shape raw records into useful signals. A transaction date may become weekday, season, or time since last purchase. A customer record may become purchase frequency or recent engagement.
- Model selection: Choose a method that fits the outcome and constraints. A transparent baseline can be more useful than a complex model that no one trusts.
- Validation: Test on future-like data, not only the records used for training. Compare the model with a sensible baseline and translate errors into operational or financial consequences.
- Deployment and decision: Put the output where the user already works, such as a CRM, inventory workflow, scheduling screen, or executive report.
The owner changes at each step. Marketing can define a lead outcome, sales can specify the follow-up action, finance can establish the value of a converted lead, and operations can decide how a forecast changes staffing. A data scientist or analyst supplies technical judgment, but the business can't outsource accountability for the decision.
A healthy pipeline also records the prediction, the action taken, and the eventual outcome. That feedback makes it possible to tell whether the model is learning useful patterns or merely producing plausible-looking numbers.
Teams that need a broader implementation checklist can review Up North Media's guide to analytics implementation, particularly when a model must connect to existing applications and reporting workflows.
The first model rarely ships unchanged. That isn't a failure. Early work exposes weak definitions, missing fields, and unrealistic decision rules. Iteration is healthy when each version is judged against a business baseline and a clear deployment requirement.
Is Your Data Good Enough to Forecast
Most small businesses don't need perfect data. They need consistent data that measures the same thing over time, covers the decision they care about, and has an owner who can correct problems.
Start with the target record. For demand forecasting, confirm that sales dates, product identifiers, quantities, prices, promotions, cancellations, and stock availability mean the same thing across the historical period. For churn, confirm that a customer has a stable identifier and that “churned” has a precise business definition. If customers appear under several emails or product names change without a mapping table, the model will learn administrative noise.
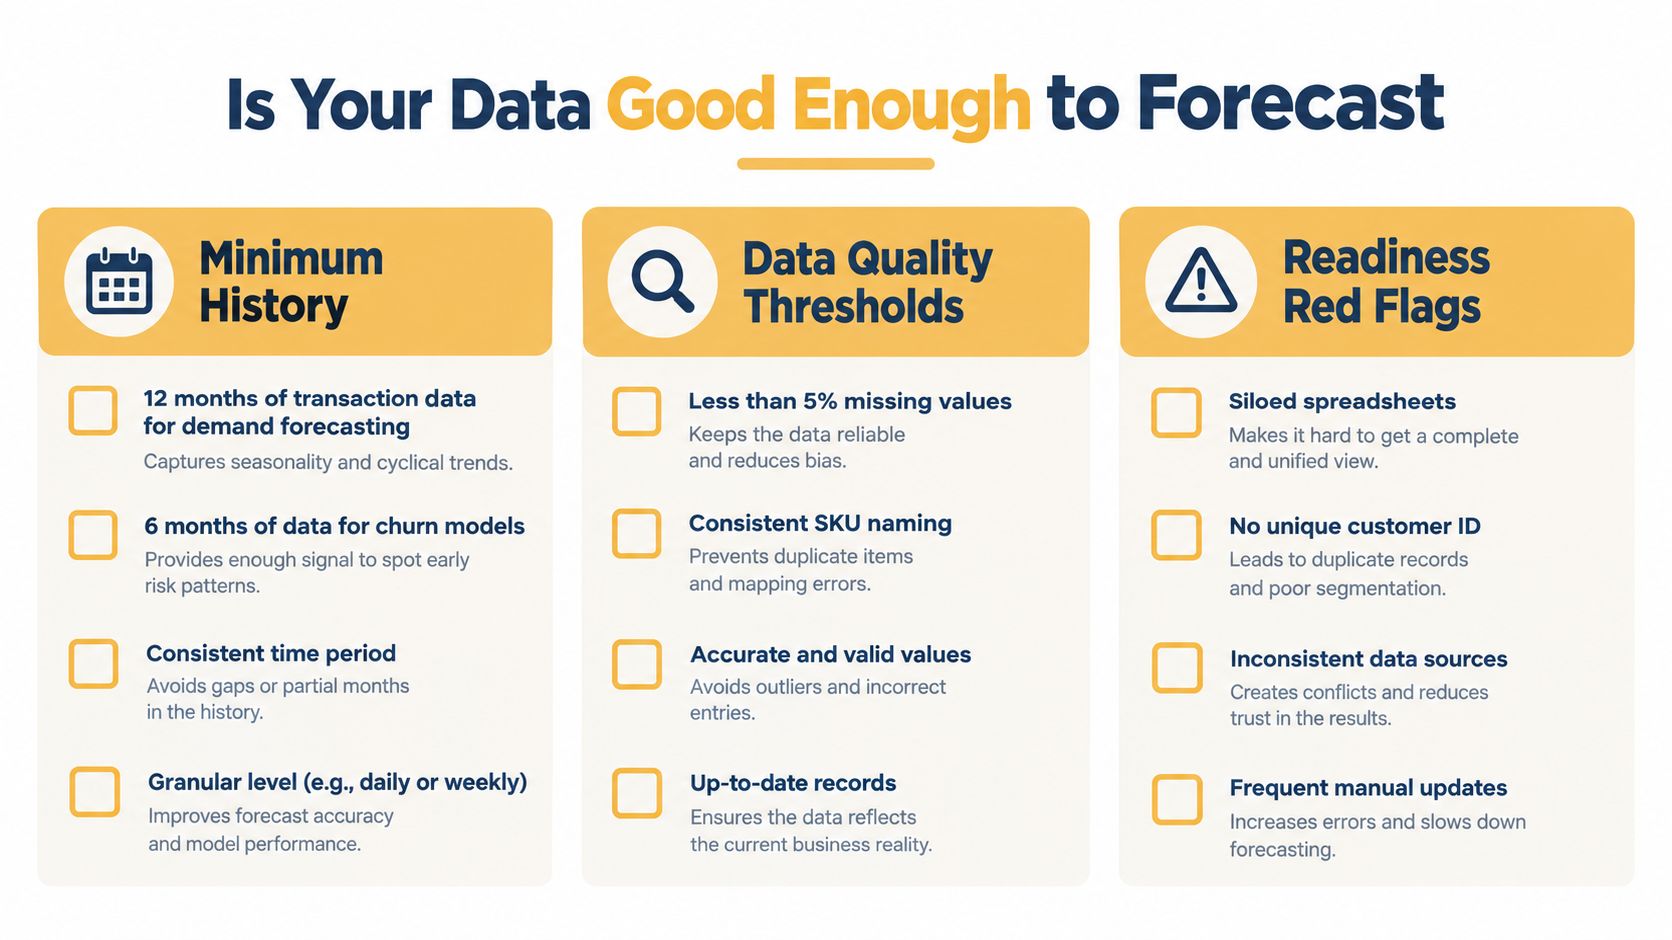
A practical readiness check
Use a short audit before paying for advanced modeling:
- Define the history: Identify the period that covers normal operating conditions, promotions, seasonal variation, and meaningful changes in the business.
- Measure missingness: Separate fields that are essential from fields that are optional. Missing customer notes may be tolerable, but missing transaction dates or outcomes can invalidate the target.
- Assign ownership: Name the person responsible for CRM fields, product records, consent status, and source-system connections.
- Reconcile identities: Create stable customer, product, location, and campaign identifiers before joining tables.
- Record availability: Mark when an item was out of stock or an appointment slot was unavailable. Otherwise, the model may interpret constrained supply as weak demand.
- Document definitions: Write down what counts as an order, lead, active customer, cancellation, conversion, and return.
A 2025 SME study found that 54% of respondents identified initial AI cost as a major adoption barrier, while 45% struggled to find skilled personnel. The same verified brief reports that more than 40% of organizations had only partially integrated data across systems, while 12% had governance embedded across the full data lifecycle. These figures come from the SME study and associated research, and they explain why a data cleanup plan deserves as much attention as model selection.
Fix the highest-value defects first
Don't rebuild every system before testing a forecast. Stage the work. First repair the fields that define the target and connect the decision to an owner. Next resolve the records that materially change segmentation or valuation. Defer low-impact enrichment until a baseline proves that the use case deserves further investment.
A simple forecast built on a smaller, trusted dataset can beat an advanced model trained on fragmented records.
For first-party customer data, the business should also establish how information is collected, defined, and used. Up North Media's explanation of what first-party data means is a useful reference for teams organizing those inputs.
Data is good enough when a knowledgeable operator can inspect a sample, explain the fields, reproduce the outcome, and identify who fixes an error. If the team can't agree on what the target means, more modeling won't solve the problem.
Choosing the Right Model and Tooling
Model complexity should follow decision complexity and data maturity. A seasonal baseline may be enough for a stable service schedule. Regression can clarify how known factors relate to an outcome. Tree-based machine learning can capture nonlinear interactions, but it usually requires more testing, explanation, and maintenance.
A major review of forecasting benchmarks found that naive forecasts, exponential smoothing, ARIMA, and Theta have repeatedly matched or outperformed more advanced alternatives across varied series, horizons, and application domains. The finding is summarized in the review of univariate forecasting benchmarks. A complex model hasn't earned production status until it beats a strong simple benchmark on future-like data.
Predictive model families compared
| Model Family | Interpretability | Best Use Case | Typical Maintenance |
|---|---|---|---|
| Naive and seasonal baselines | Very high | Stable demand or capacity series | Low, with periodic performance checks |
| Regression | High | Outcomes influenced by known, explainable variables | Moderate, especially when relationships change |
| Exponential smoothing and ARIMA | High to moderate | Structured time-series forecasting | Moderate, with parameter and seasonality review |
| Decision trees and random forests | Moderate | Classification, ranking, and mixed tabular data | Moderate to high, with drift and feature checks |
| Gradient boosting | Moderate to low | Complex tabular prediction and lead scoring | High, with careful tuning and monitoring |
| Neural and deep learning models | Low to moderate | Large, complex, high-dimensional inputs | High, including infrastructure and retraining |
The tooling decision follows a similar ladder. Spreadsheet or BI forecasting can be appropriate for a small, well-understood series. AutoML can reduce setup effort when the data is structured and the team can still validate the output. Custom code makes sense when the prediction must integrate tightly with pricing, inventory, CRM, or application logic.
Test performance the way the business operates
Use rolling-origin backtesting. Train on an earlier window, predict the next period, move the window forward, and repeat. This approach exposes models that fit history beautifully but fail when conditions change.
Evaluate more than a single accuracy score. Weighted absolute percentage error can prevent high-value products from disappearing inside an aggregate result. Forecast bias shows whether the system consistently overstates or understates demand. Revenue, margin, avoided labor cost, stockout exposure, or qualified-pipeline value connects model performance to the decision.
Teams looking for a practical guide to choosing among model types can use algorithm selection as a starting point. The final choice should remain accountable to the business problem, not to the novelty of the technique.
From Pilot to a System That Keeps Working
A pilot should be designed to answer a commercial question, not to demonstrate that a model can run. Establish the current process, define the baseline, choose the outcome, and decide what evidence would justify expansion. If possible, compare locations, customer groups, products, or time periods in a controlled way, while avoiding changes that would make the comparison meaningless.
The primary metric should reflect value. Contribution margin may matter more than conversion rate. Avoided labor cost may matter more than forecast error. A retention model should be judged by retained value after an intervention, not only by how well it ranked customers who later left.
Recent Adobe research reported that only 12% of organizations had working AI solutions demonstrating clear ROI. Among organizations still in pilot phases, 34% had strong ROI-tracking metrics, compared with nearly two-thirds of organizations with proven solutions, according to Adobe's digital trends research. The lesson is direct: teams need measurement design before they need more model sophistication.
Put the prediction where work happens
A batch forecast may be enough for weekly purchasing or staffing. A real-time score may be justified when a salesperson or site visitor needs an immediate decision. Either way, decide where the output lives:
- CRM workflow: Lead scores should include a reason, next action, and owner.
- Inventory process: Demand estimates should connect to reorder, allocation, or promotion decisions.
- Web application: Recommendations should respect availability, margin, and customer experience rules.
- Operations dashboard: Alerts should identify what changed and what the operator can do next.
Maintenance starts as soon as the model goes live. Track predictive quality, calibration, data completeness, input drift, subgroup disparities, and downstream outcomes. A model can preserve an acceptable ranking while its probabilities become poorly calibrated, or a change in traffic sources can make an old acquisition feature unreliable.
Define failure before it arrives
Set alert thresholds and decide who receives them. Compare the current champion with a challenger rather than replacing a working model blindly. Establish retraining criteria, human review for high-impact decisions, and a rollback path that returns the team to a trusted baseline.
The same operating logic applies beyond marketing and ecommerce. Manufacturers evaluating how to optimize production with condition monitoring need the sensor pipeline, alert ownership, maintenance workflow, and outcome measurement, not just a failure prediction score.
Predictive analytics becomes a capability when people use it repeatedly, verify its results, and know what happens when it fails. Up North Media's role can include connecting forecasting and scoring to web applications, SEO workflows, CRM handoffs, and reporting so the prediction reaches the decision rather than remaining trapped in a model file.
Up North Media helps businesses define practical forecasting and scoring use cases, improve the data behind them, and connect predictions to web applications, marketing workflows, and operational decisions. Visit Up North Media to discuss a measurable predictive analytics project built around your data, budget, and next business decision.