
Your conversion dashboard says performance is falling. The CRM says leads are steady. The payment platform shows fewer completed transactions, while the analytics property reports a different total again. Before anyone rewrites the homepage, treat the discrepancy as the problem.
A conversion rate optimization audit is a diagnostic process, not a design preference exercise. It should establish whether the baseline is reliable, locate the funnel leak, explain the user behavior behind it, and turn evidence into experiments that the team can run. The order matters. Optimizing a broken measurement system produces confident recommendations built on unreliable numbers.
When the Numbers Stop Adding Up
A growth lead notices that checkout conversion has dropped from 3.2% to 1.9% over six weeks. The marketing dashboard blames paid traffic. The CRM shows roughly the same number of qualified opportunities. The analytics property and payment platform disagree, and three people have already proposed a homepage redesign.
That reaction is common because visible design changes feel actionable. They also let teams avoid the harder questions. Did a tag stop firing on a single-page application route? Did consent handling change what analytics can observe? Did attribution rules move conversions between channels? Is the homepage involved, or is one checkout step failing on mobile?
The first useful action is to preserve the evidence. Record the reported decline, identify when it began, list every site, campaign, analytics, consent, and checkout change made around that period, then compare the same funnel in independent systems. A benchmark can provide context, but it can't explain your specific leak. For ecommerce teams, ecommerce conversion rate benchmarks are useful only after your own event definitions and transaction data agree.
Diagnose before redesigning
The redesign reflex starts with a solution. A diagnostic audit starts with competing explanations and tries to eliminate them in a controlled order. That distinction protects working elements from unnecessary change and keeps the team focused on observable friction.
A practical audit moves through seven connected activities:
- Measurement hygiene: Confirm that events, consent states, filters, and transaction records are valid.
- Data triangulation: Compare analytics, CRM, payment, traffic, device, and funnel views.
- Heuristic review: Inspect the pages and steps where the evidence shows meaningful friction.
- Hypothesis design: Convert findings into falsifiable statements tied to an audience and KPI.
- Hypothesis scoring: Rank opportunities by impact, effort, confidence, data quality, and testability.
- Roadmap sequencing: Group experiments without fragmenting traffic or creating conflicting changes.
- KPI reporting: Capture what was learned, not just whether a variation appeared to win.
A/B testing belongs inside this system because it supplies measurable baseline and improvement data. In a 2026 benchmark covering 1,055 A/B tests, the median control conversion rate was 4.6%, the median uplift from winning tests was 1.88%, and median revenue-per-visitor uplift was 2.77% according to the benchmark dataset. Only 36.3% of tests produced a statistically significant winner at the 95% confidence level, so a serious audit must identify strong friction points before asking experimentation to produce results.
Verifying Your Analytics Are Actually Trustworthy
Measurement integrity comes before optimization. If the conversion event fires twice, omits consent context, includes internal traffic, or fails to reconcile with completed sales, the reported conversion rate isn't a dependable baseline.
Start with the implementation rather than the dashboard. Use browser debugging tools and your tag manager's preview mode to confirm that the analytics tag fires once on every important route. Test product pages, forms, cart actions, checkout steps, confirmation pages, gated content, subdomains, and single-page application transitions. A page view that works during a normal navigation path can still fail when a route changes without a full reload. The analytics implementation guide can help teams document these paths before testing begins.
Five checks for a clean baseline
-
Match transactions across systems. Compare analytics conversions with CRM records and payment-platform transactions over the same period, using the same timezone and conversion definition. A variance above 5% is a red flag under the audit framework described in this CRO measurement integrity guide. Investigate missing events, duplicates, refunds, delayed imports, and attribution differences before analyzing performance.
-
Inspect consent and data-layer values. A new consent banner can alter which events are collected and which identifiers persist. Check whether consent state travels with each relevant event, whether the data layer populates consistently, and whether denied or unknown states are being interpreted correctly. Don't treat a sudden reporting decline as behavioral until you rule out a collection change.
-
Test event definitions against real actions. “Form submission” should represent a completed submission, not a button click. “Purchase” should represent a confirmed transaction, not a checkout page view. Write the event contract in plain language, then test it with successful, failed, abandoned, refreshed, and back-button journeys.
-
Check filters and traffic quality. Review bot exclusion, internal-traffic rules, referral exclusions, cross-domain behavior, and duplicate tags. A sudden session spike or an unusually strong internal segment can distort both the numerator and denominator.
-
Align reporting settings. Compare timezone, date ranges, attribution windows, sampling or threshold notices, currency treatment, and identity settings. Two accurate tools can still disagree when they answer different questions.
Teams that rely on forecasting should verify the demand inputs before using them to plan traffic or conversion scenarios. These niche research forecasting tips are relevant because unreliable demand assumptions can make a clean funnel look like a weak one. Skip this foundation and every later insight becomes guesswork.
Reading Funnels, Segments and Behavior Signals Together
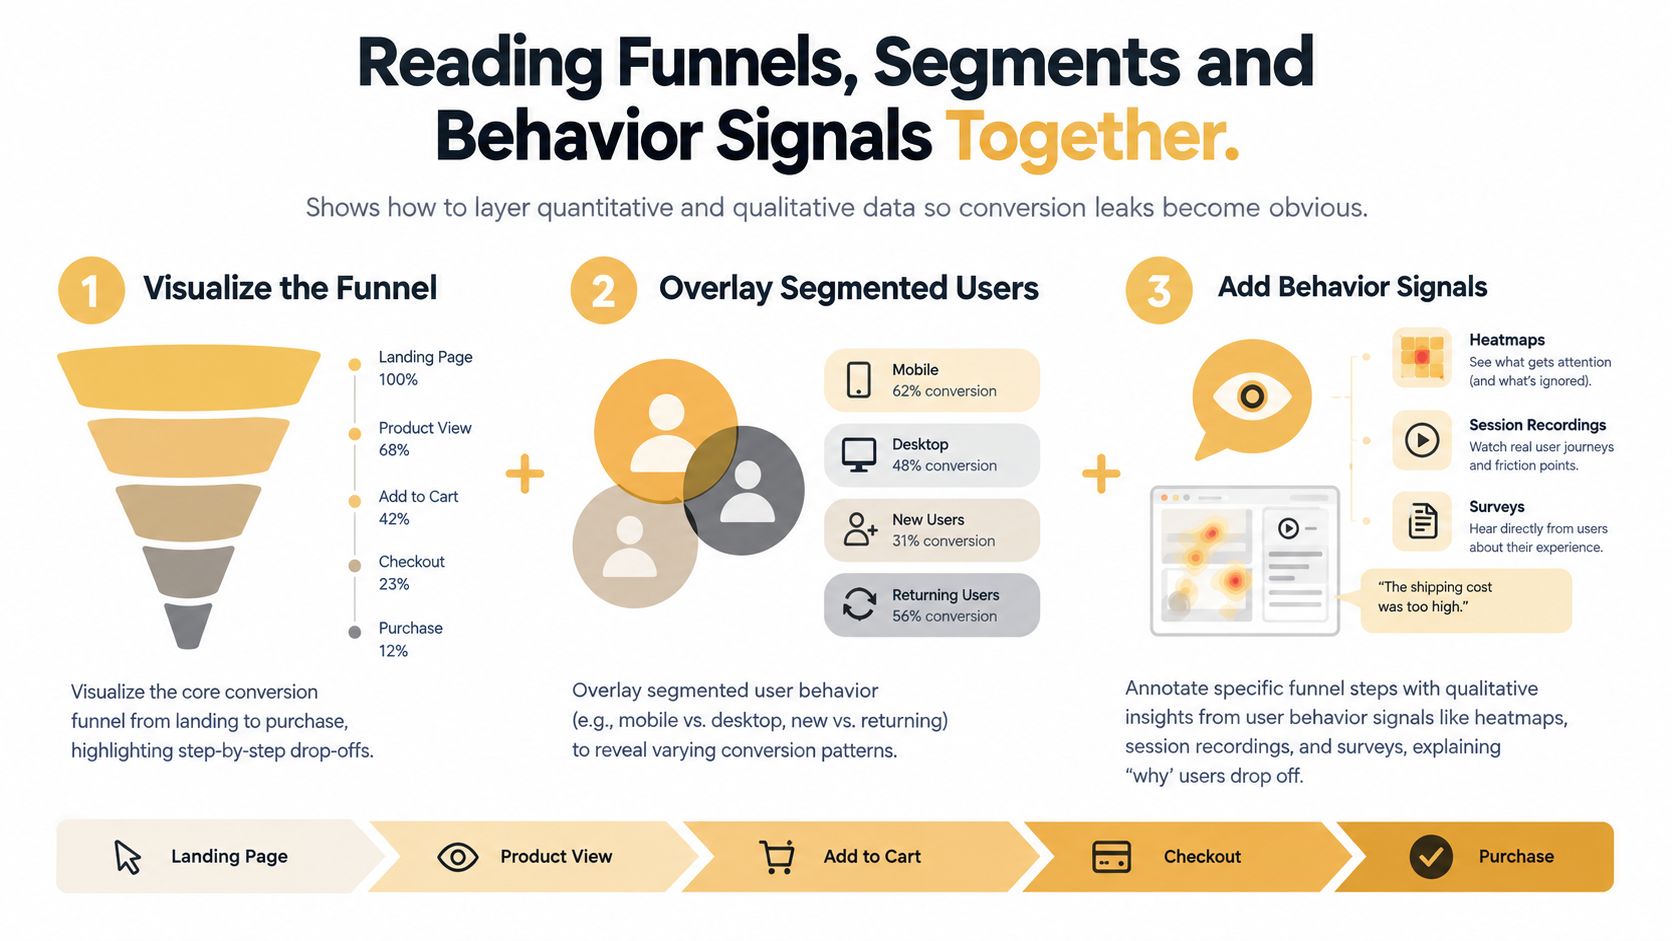
A funnel can show where users disappear, but it cannot explain the reason. Segments reveal who is affected, while behavioral evidence shows what those users encountered. Read the three views together, and keep measurement integrity in mind before treating any pattern as product friction.
Start with the first meaningful landing action and follow the path to the business outcome. An ecommerce flow may include product interaction, cart entry, checkout start, payment submission, and purchase. A lead-generation flow may use form start, field interaction, submission, and qualified lead acceptance. Compare every step with its historical baseline. If a step's drop-off exceeds that baseline by more than 15%, mark it for investigation. The threshold comes from the audit brief. Use it to set priorities, not to claim causality.
Compare the audiences behind the leak
Aggregate reporting can conceal sharply different experiences. Cart abandonment may cluster among mobile visitors from paid social, while returning desktop visitors from email complete the same flow with little trouble. Diagnose those groups separately before proposing a shared fix.
Create comparison views across:
- Device and browser: Check rendering, tap targets, input behavior, and payment differences.
- New versus returning users: Separate discovery friction from repeat-purchase friction.
- Traffic source and landing page: Test message match and intent quality.
- Geography and consent state: Identify experience or measurement differences without assuming causality.
- Product, plan, or form type: Determine whether the problem belongs to one offer.
Apply heatmaps and session recordings to pages with the most meaningful leak. Look for rage clicks, dead clicks, abrupt scroll-depth cliffs, repeated field corrections, hesitation before an important action, and errors immediately before abandonment. A recording illustrates one journey, not the rate at which a problem occurs. One dramatic session should prompt investigation, not enter the roadmap by itself.
Use a simple triangulation rule: treat a friction point as credible when at least two of three signals agree, a funnel anomaly, a segment skew, or a behavioral artifact. If only one signal appears, label the finding exploratory and collect more evidence before assigning development capacity.
Heuristic Checks That Catch the Real Friction
Heuristic review works best when it follows the evidence. Don't critique every color, border, animation, or spacing decision. Inspect the most impactful pages and ask whether the observed interface could plausibly explain the funnel or behavior signal already identified.
The review should cover value clarity above the fold, form friction, trust near the decision point, mobile tap targets, perceived speed, error recovery, and the number of checkout or signup steps. Test the journey as a new visitor, a returning visitor, a mobile user, and a user arriving from the relevant campaign. Record the exact screen, URL, device context, observed behavior, and rationale.
Use a compact scoring matrix
Score severity and fix effort separately. Severity reflects likely business and user harm. Effort reflects implementation complexity, dependencies, review requirements, and release risk. Evidence keeps the score challengeable.
| Heuristic Check | Severity (1-5) | Fix Effort (1-5) | Evidence |
|---|---|---|---|
| Value proposition clarity | Landing-page exits, user confusion, or weak first-step progression | ||
| Form length and field friction | Repeated corrections, incomplete fields, or form-start abandonment | ||
| Trust signals near decision points | Support objections, hesitation, or exits around pricing and checkout | ||
| Mobile tap targets and layout | Session recordings, device-specific errors, or failed interactions | ||
| Page speed perception | Slow-loading elements, blank states, or abandonment during render | ||
| Checkout or signup step count | Drop-off concentrated between successive steps |
A high-severity, low-effort issue may deserve an immediate bug fix. A high-severity, high-effort issue needs a hypothesis and roadmap slot. A low-severity cosmetic complaint with no corroborating behavior should remain out of the active backlog.
Evidence standard: A heuristic observation becomes a CRO finding only when the page-level concern connects to a measurable funnel or behavior signal.
Document the screen-level proof so leadership can accept, reject, or challenge the finding without repeating the entire audit. For checkout-specific issues, pair the review with ecommerce checkout optimization guidance, then test the actual journey rather than relying on screenshots.
Turning Findings Into Prioritized Hypotheses
A finding describes a problem. A hypothesis defines the explanation, change, audience, outcome, and measurement that the team can test. “Redesign the hero section” is a project request. A usable hypothesis gives analysts and developers a clear decision rule.
Use this structure:
Because [behavior signal], changing [specific element] for [specific audience] will produce [intended outcome], measured by [primary KPI] and protected by [guardrail metric].
For example:
Because mobile checkout recordings show repeated taps on the crowded payment control and the mobile funnel declines 22% at the payment step, changing the payment section to a single-column layout for first-time mobile visitors will reduce payment-step abandonment, measured by checkout completion rate and protected by average order value.
The example connects observed behavior to one change and a defined audience. It does not assume that a full checkout redesign is necessary before smaller changes have been tested.
Rank evidence, not excitement
ICE or PXL can organize discussion, but a score should not decide the backlog by itself. Adjust each opportunity for traffic sufficiency, confidence in the underlying data, implementation dependencies, and whether the change could block another experiment. A dramatic idea based on unreliable tracking should wait behind a modest fix supported by clean evidence.
Keep three practical buckets:
- Now: Fixes or tests supported by strong evidence and feasible within current delivery capacity.
- Next: Credible opportunities that need design, engineering, research, or additional traffic.
- Later: Strategic changes, personalization, or redesign concepts that depend on earlier learning.
Limit the active list to work the team can launch, monitor, analyze, and discuss during its operating cycle. Archive rejected ideas with the reason, evidence reviewed, and rejection date. That record prevents the same opinion from returning without new evidence.
Before accepting an A/B result as durable learning, check experiment hygiene. Review sample-ratio mismatch, result peeking, multiple comparisons, preplanned primary metrics, and adequate power. Statistical significance alone does not repair weak instrumentation or an uncontrolled testing process.
Building the Testing Roadmap
A testing roadmap should protect learning quality before it maximizes launch volume. Sequence work around the evidence already validated, and avoid introducing changes that make the result impossible to interpret. When a treatment improves the experience and clears the analysis checks, ship it rather than leaving the winner inside the testing platform.
Plan by dependencies, not by theme
Build each wave around a decision the team needs to make. A checkout clarity test might come before a form interaction test if the first result determines which friction remains worth investigating. Keep experiments apart when they alter the same control, audience, or funnel step. Their interaction can make both outcomes difficult to explain.
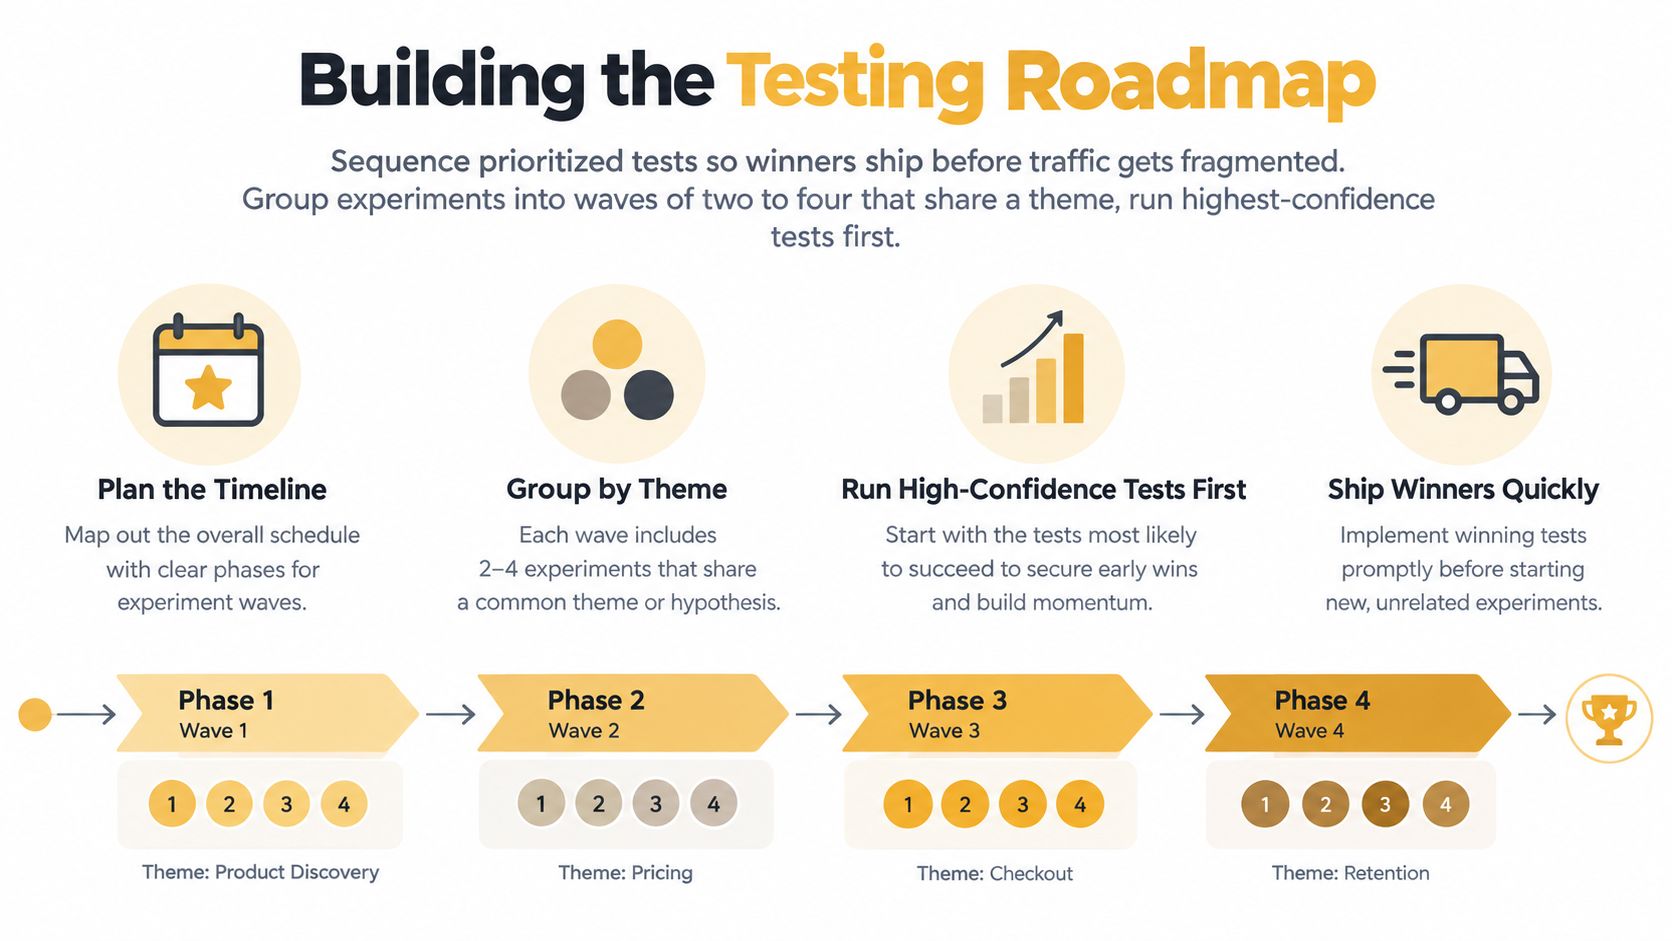
Set traffic allocation according to page volume, business risk, and the required power calculation. A balanced split can support a clean comparison on a major page. A lower-volume page may need a different allocation, but a launch calendar is not a stopping rule. Decide in advance how the result will be analyzed.
Write the decision record before launch:
- Learning goal: State the behavior or uncertainty the experiment should clarify.
- Primary metric: Name the outcome that determines success.
- Guardrails: Identify signals that must hold, including support contacts or downstream quality.
- Stop conditions: Record technical failures, severe regressions, invalidation rules, and the planned analysis method.
Keep redesign-level work behind foundational learning. A redesign can be appropriate when the current experience has structural problems, yet changing many variables at once weakens the explanation for any performance shift. Smaller tests can isolate the message, interaction, or trust barrier first. That evidence gives the larger investment a clearer brief and a better chance of producing a result the team can interpret.
Tracking KPIs and Reporting What Matters
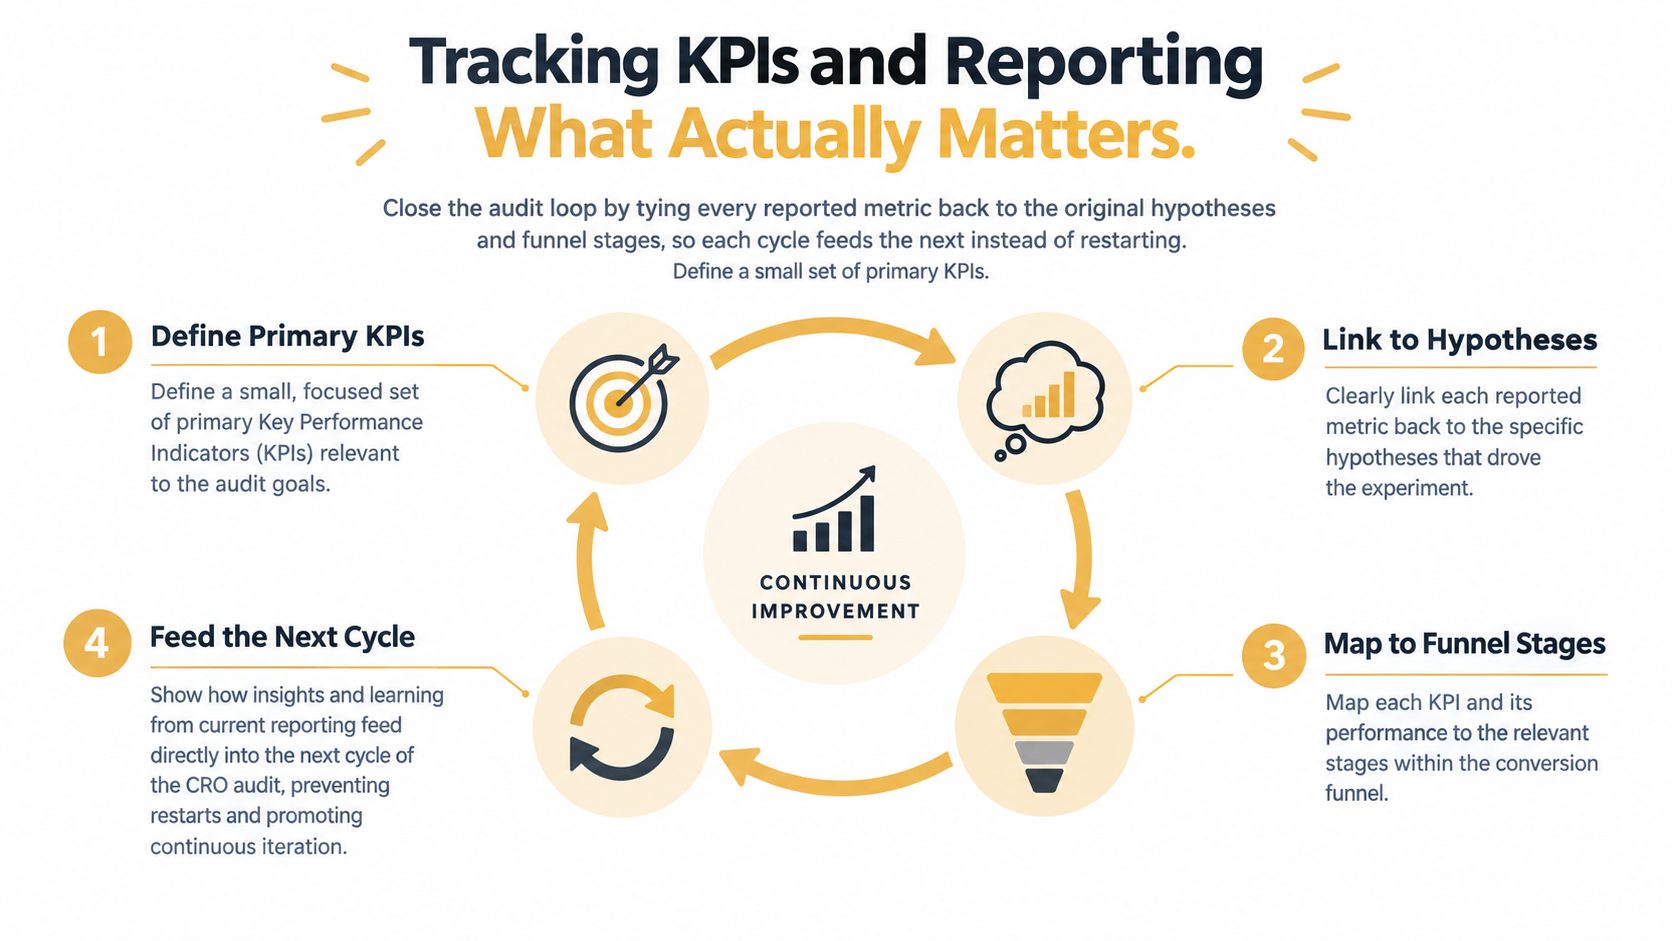
A CRO program loses value when reporting becomes a weekly search for a positive percentage. Before interpreting movement, confirm that consent rules, analytics events, attribution, and CRM outcomes reconcile. A polished dashboard cannot rescue a broken baseline. The useful question is whether the experiment answered its hypothesis, affected the intended audience, protected the business outcome, and produced a decision the team can act on.
Choose a small primary KPI set that matches the funnel. Conversion rate measures completion, while revenue per visitor connects the experience to commercial value. An assist rate can capture meaningful supporting actions when the final conversion happens later. Pair these measures with guardrails such as bounce behavior, page-load experience, support tickets, lead quality, or refund behavior, depending on the business model. Record which systems supply each metric and investigate discrepancies before making a decision.
Build a one-page learning record
A useful report can fit on one page when the team has defined the question properly:
| Report Field | What to Record |
|---|---|
| Hypothesis tested | The behavior, change, audience, and expected outcome |
| Primary result | Direction and magnitude of the observed movement |
| Confidence and validity | Analysis method, test health, and known limitations |
| Segment impact | Which audiences changed and which did not |
| Learning applied | What the result changes in the backlog or experience |
| Next move | Ship, iterate, retest, investigate, or archive |
Review active tests weekly so technical issues and guardrail problems surface quickly. Review the broader backlog monthly, then refresh the audit when traffic mix, product structure, measurement rules, or customer behavior changes materially. The schedule should fit the business, but the learning loop must continue between launches.
Multiple comparisons can create false positives, so avoid presenting every favorable movement as a discovery. The Management Science research on experiment hygiene examines this testing risk. Report uncertainty plainly, preserve rejected ideas, and feed validated findings back into the next audit backlog. Optimization compounds when measurement remains trustworthy and each result changes the next decision, rather than sending the team back to another homepage redesign.
Up North Media offers CRO services that include A/B testing and website optimization, alongside analytics-focused audit work covering heatmaps, form starts, call clicks, and device breakdowns. If your team needs help validating its baseline or turning funnel evidence into a conversion roadmap, visit Up North Media to request a consultation.