
A shopper clicks a paid ad, lands on your homepage, sees the same hero banner every other visitor sees, scrolls twice, and leaves. Nothing on that page told her you knew why she came. Multiply that by a few thousand sessions a month and the leak is bigger than most merchandising wins.
Personalization pays off when three things line up. A clear signal, one specific page that changes because of it, and a baseline you measured before you shipped the change. Miss any of the three and you're guessing with extra steps.
The expectation is already set. McKinsey's personalization research found that 71% of consumers expected companies to provide personalized interactions, and 76% said they became frustrated when those interactions were absent. The same study put the most common revenue lift at 10% to 15%.
The ecommerce personalization examples below are worth studying for their mechanics, not their trophies. Each one runs on a single signal, and each comes with a caveat that keeps the reported number in perspective. If you want the groundwork first, these small business website personalization tips cover what to fix before you buy software.
1. Saks Fifth Avenue
Saks changes its homepage based on what a shopper appears to be shopping for, using predicted purchase intent built from past behavior plus whatever the visitor is doing in the current session. That's a different approach from fixed segments like "women's contemporary" that someone set up months ago and never revisited. The same intent logic feeds some product-page recommendations.
Shoppers notice the difference. In 2024, 64% of U.S. consumers said they could tell whether an online shopping journey was personalized, according to Mintel's personalization in online shopping report. A generic homepage reads as generic.
The reported result, per Saks, was a 9.5% conversion improvement, a 7% lift in revenue per visitor, and an 18.4% reduction in homepage bounce rate. Three metrics touching three parts of the funnel. That's the shape of a well-instrumented test.
What you can copy: Start with one page and one signal. Don't rebuild the whole site.
A mid-size store can run a smaller version. Change the hero module and the first product row based on last-viewed category, hold back a control group for four weeks, and read bounce rate and revenue per visitor before you read conversion. If swapping content by segment is new territory, this guide to dynamic content for website personalization walks through the setup.
The caveat. These figures are company-reported by a large retailer with a mature data stack. Implementation cost wasn't disclosed, and your lift will be smaller and slower.
2. Ruggable
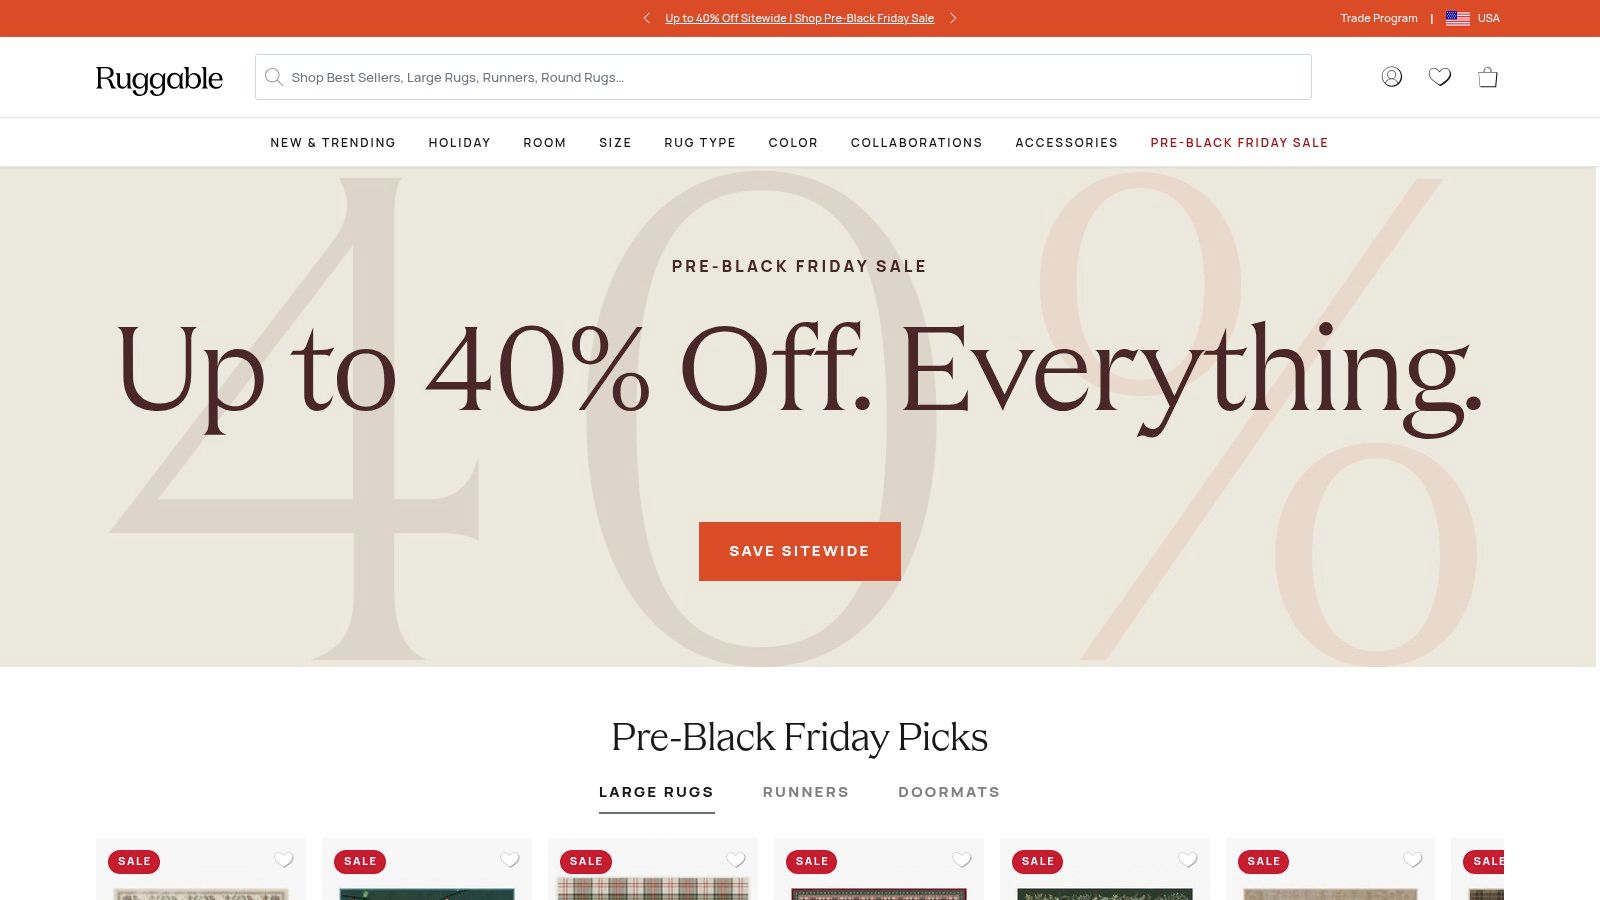
Rugs are hard to browse. The category is visual, the assortment is deep, and most shoppers can't type what they want into a search box. Ruggable answers that with a guided quiz that captures style preferences and recommends matching products, plus a room-photo upload so shoppers can match a rug to the space they're decorating.
This is declared preference, not inferred behavior, and the appetite for it is real. NielsenIQ's 2024 shopper research found that 72% of consumers expected retailers to know them on a personal level. A quiz is the most direct way a store can ask.
Shopify's case study reports quiz-takers converted at roughly four times the rate of other shoppers, per Ruggable. Read that as correlation. People who finish a quiz already arrived with intent.
- Keep the quiz optional. Put "browse all rugs" beside "find my rug" so browsers aren't forced into a funnel.
- Cap it at five or six questions. Every extra question costs completions.
- Use the answers downstream. Tag the customer profile and feed it into email and on-site recommendations, or you've paid for data you never deploy.
The caveat. Self-selection explains much of that gap. Test the quiz against a control before you credit it with the conversion difference.
3. Omy Laboratories
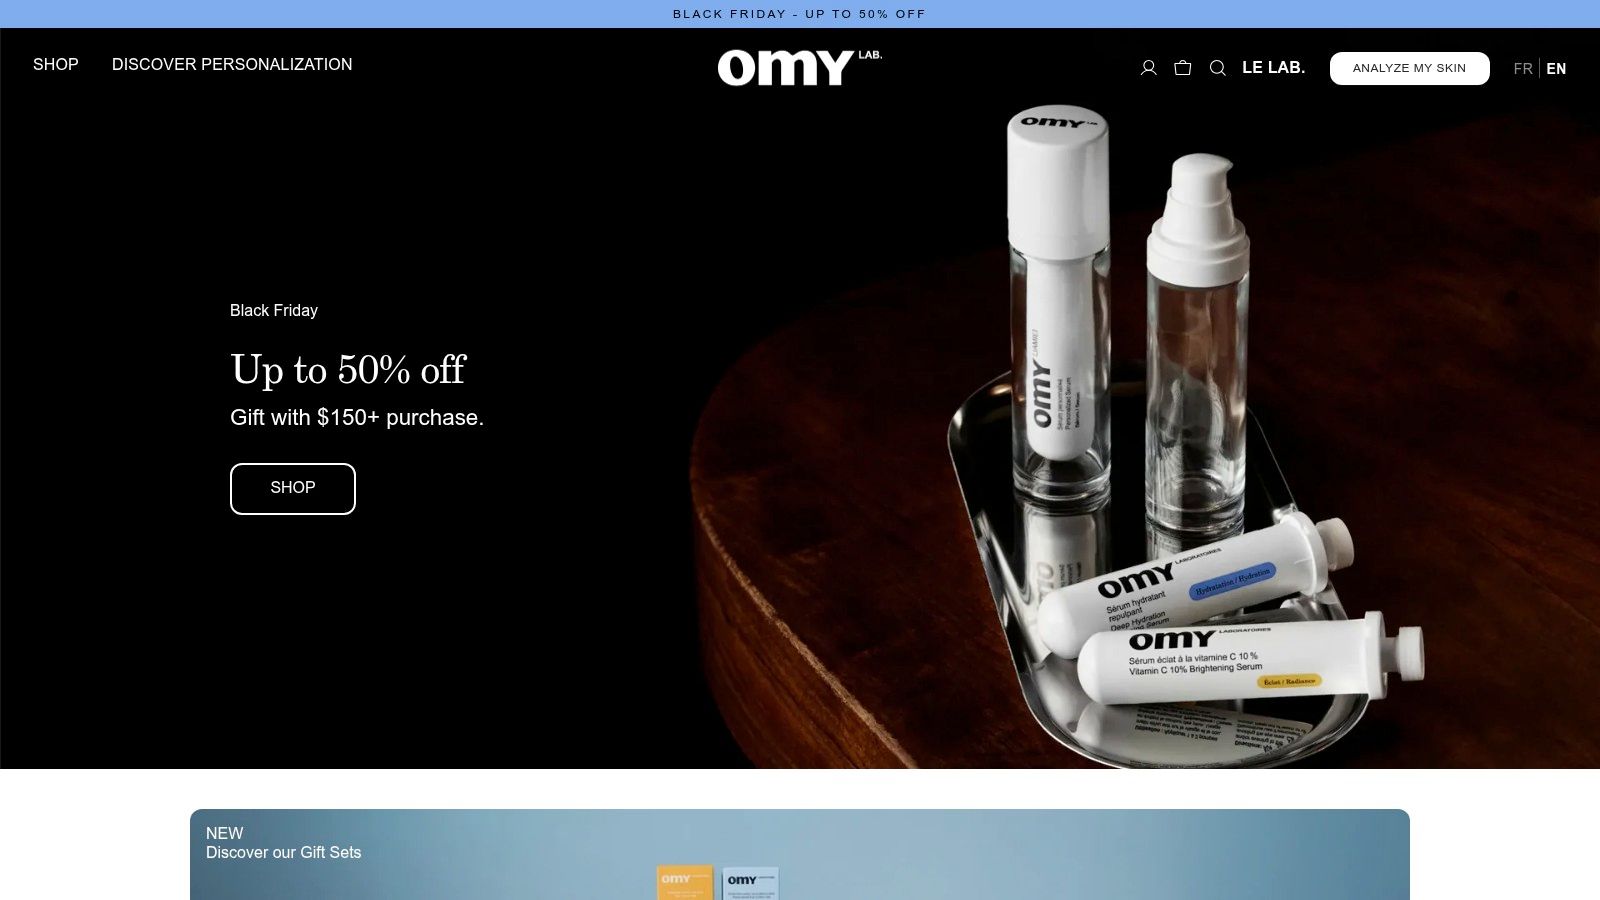
Omy makes personalization the product rather than a layer on top of it. Shoppers customize a skincare formulation instead of picking a fixed SKU, and the storefront carries a customizer, customer profiles that store each formula for review, and a subscription for repeat orders.
Shopify's case study reports a 60% year-over-year increase in sessions and a 35% boost in repeat purchases after the personalized storefront launched, per Omy Laboratories.
Where customization beats recommendations
For configurable or made-to-order products, saving the configuration does more for retention than any "you may also like" row. A shopper who reorders the same formula in two clicks has a reason to skip the marketplace, and a competitor can't show her an identical product because the formula is hers.
- Save the spec, not just the cart. Reordering only works when the saved formula is the account default.
- Show the formula on the profile page. People forget what they chose eight weeks ago.
- Price the complexity. Custom picks and made-to-order fulfillment add cost, and the margin has to cover it.
The caveat. Customization is friction at checkout. Fewer people will finish a configured order than a standard one, so judge it on repeat rate and lifetime value rather than first-purchase conversion. The reported figures come from one merchant and won't transfer directly to yours.
4. Parachute
Most personalization advice stops at the algorithm. Parachute applies the same idea to service. Staff can pull up previous conversations and purchase history, and the team follows up after an order with something relevant instead of a generic survey.
Shopify reports that Parachute's broader changes, including personalized service and inventory management, were associated with a 12% increase in average order value, more than $1 million in operational savings, and fivefold growth in buy-online-pick-up-in-store sales over four years, per Parachute. Three changes shipped together, so none of them can claim the order-value lift alone.
The privacy side deserves equal weight. Capgemini's consumer trends research found that 69% of consumers worry about personal data being used to create hyper-personalized content. A store associate reciting a customer's history across a counter is the moment that worry stops being abstract. Train staff on what to reference, and say out loud why the history helps.
- Write the note. Have associates log context in a shared field after each conversation, while it's fresh.
- Follow up inside a week. Relevance decays faster than assumed.
- Keep it first-party. Your own order and conversation data is easier to explain to a customer than a third-party profile. If the distinction is fuzzy, this explainer on what first-party data is covers the boundaries.
The caveat. No physical store means you can copy the follow-up, not the counter conversation.
5. Ocado
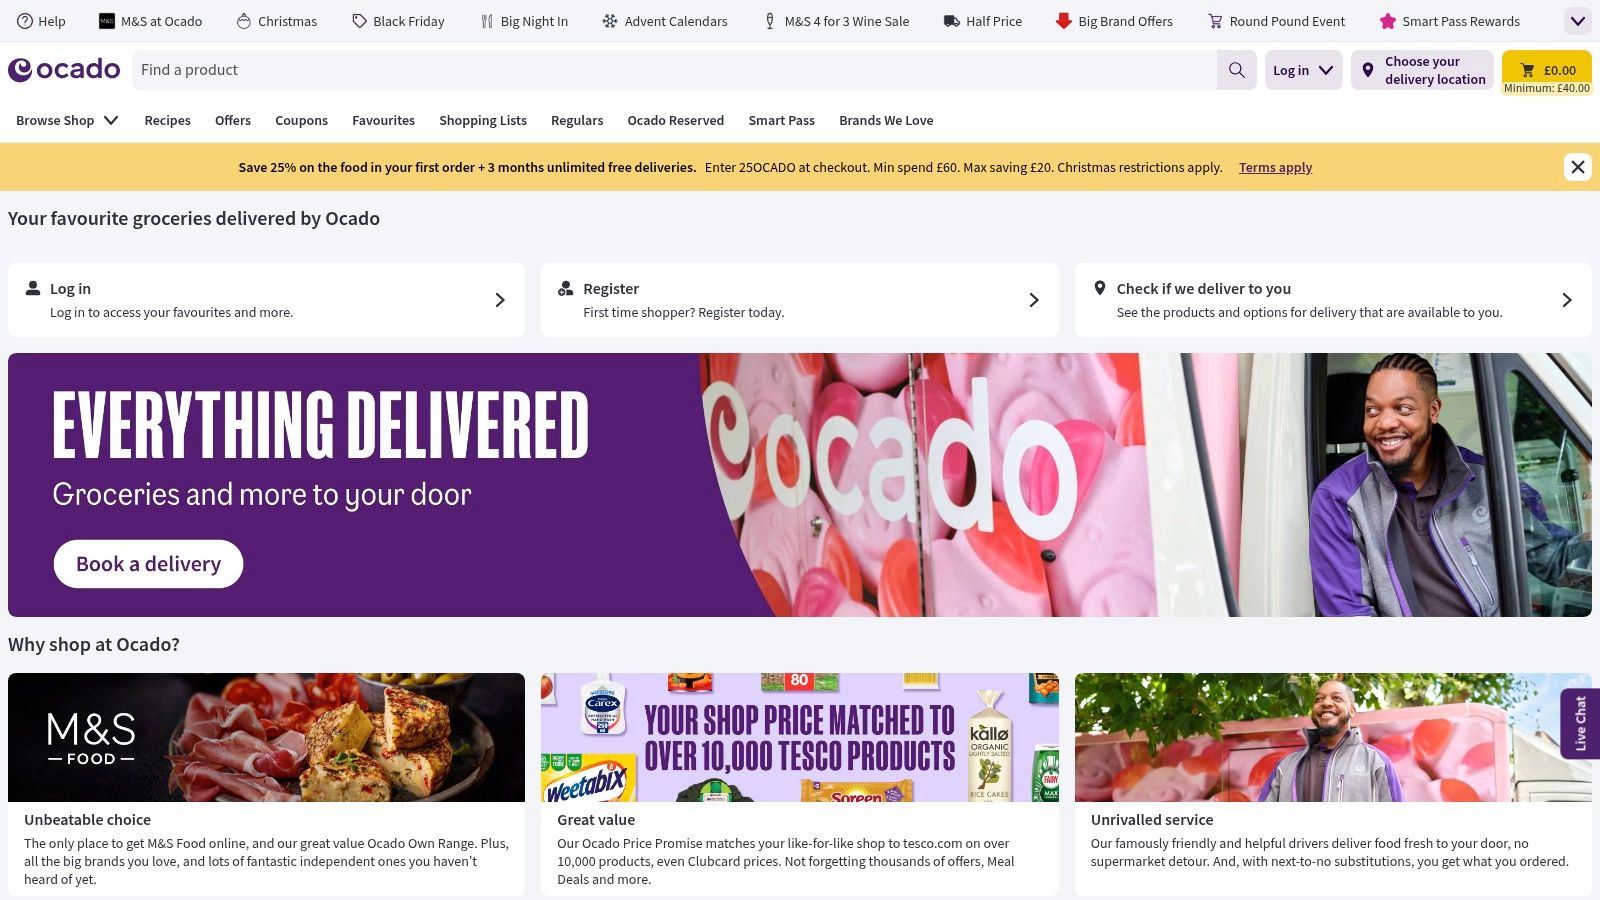
Ocado personalizes by lifecycle stage rather than by product affinity. New visitors can browse and fill a basket before being pushed to create an account. Returning shoppers get offers built from order history. Someone approaching a fifth order sees progress toward a reward plus an offer designed to trigger the next basket. Mastercard reports a 13.5% increase in Smart Pass subscriptions during the program, per Ocado.
Copy the milestone, not the discount
The transferable idea is the visible countdown. "Two orders to your reward" beats a percentage off in most cases, because the shopper can see exactly what she'd forfeit by stopping. Grocery suits a purchase-count reward better than a considered purchase like a sofa, where repeat cycles run in years.
A progress bar is cheap to build and easy to kill. Give it a time limit and a control group, or it quietly becomes a permanent margin cost.
- Defer the signup. Let first-time visitors add to basket before the account wall appears.
- Set the threshold from your own data. Use the median order count at which repeat behavior stabilizes in your category.
- Cap the reward cost. Work out the margin you can give up per redeemed milestone before launch, not after.
The caveat. The subscription lift says nothing about profitability. If you're building segments from visit frequency or basket history, this guide to behavioral targeting explains how those groups are usually defined.
6. Cencosud
Cencosud runs supermarkets, home improvement, and department stores, and used Amazon Personalize to recommend products across those business lines. AWS reports a 600% increase in click-through rates and a nearly 26% increase in average order value compared with the company's earlier non-machine-learning approach, per Cencosud.
A 600% click jump is a comparison against a weak baseline, not a strong one. That's the honest read. If your recommendation row is hand-merchandised, machine learning will beat it easily. If you already run a decent collaborative filter, expect far less.
What makes the case useful is the measurement frame. Engagement and basket economics move separately. Beauty retailer MonAmie reported a 14% increase in ecommerce revenue, a 14% increase in average order value, and a 200% increase in customers engaging with the recommendation section, according to the AWS MonAmie case study. Huge engagement, moderate revenue. Instrument both or you'll overrate the widget.
- Benchmark against your current logic, not against a hypothetical.
- Separate recommendation-driven views from organic views in analytics before you report anything.
- Segment by tenure and catalog depth. Cold-start shoppers behave nothing like loyalists.
The caveat. These are vendor-published results, and the case doesn't detail placements or testing methodology. Treat them as directional.
7. Bydee
Bydee sells swimwear into multiple countries and adapts its storefront per market. That's personalization at the cohort level, and for a brand selling abroad it's often the highest-return version available. Currency, sizing conventions, shipping thresholds, duties messaging, and payment methods all change what a shopper trusts at checkout.
Shopify reports a 26% increase in average order value and 189% growth in global sales revenue over two years, per Bydee. The source doesn't say which elements were localized, so don't assume the currency switcher did the work.
Localization is the least glamorous personalization on this list and usually the easiest to justify, because the shopper's problem is concrete rather than inferred.
The tactic to test is narrow. Pick one overseas market that already sends you traffic, then change three things: local currency pricing, a shipping promise that matches actual delivery times, and a returns line written for that market's expectations. Measure order value and checkout completion against the previous experience for that country only.
- Start with currency and delivery. Those two drive most international abandonment.
- Keep legal and tax copy local. Generic international boilerplate reads as risk.
- Watch the operational load. Cross-border returns and duties carry real cost per market.
The caveat. Two years of growth includes new products, more ad spend, and better creative. Localization is one input among several.
How the seven ecommerce personalization examples compare
| Item | Personalization Signal | Reported Result | Best Fit For |
|---|---|---|---|
| Saks Fifth Avenue | Predicted intent, past behavior, and current-session activity | Company-reported: conversion up 9.5%, revenue per visitor up 7%, bounce rate down 18.4% | Retailers personalizing high-impact pages using real-time customer data |
| Ruggable | Style quiz answers and uploaded room photos | Shopify reports quiz-takers converted at four times the rate; the comparison does not establish causation | Retailers with broad, visually subjective product assortments |
| Omy Laboratories | Skincare preferences used to create tailored formulas | Shopify case study reports sessions up 60% year over year and repeat purchases up 35% | Customizable, made-to-order, or subscription products |
| Parachute | Purchase history and prior conversations shared across online and store interactions | Shopify reports average order value up 12%, over $1 million in operational savings, and buy-online-pick-up-in-store sales growing fivefold; results combine several changes | Omnichannel retailers with physical stores and coordinated customer data |
| Ocado | Customer lifecycle stage, order history, and purchase milestones | Mastercard reports Smart Pass subscriptions increased 13.5% during the program | Grocery and other businesses focused on repeat purchases and loyalty |
| Cencosud | Machine-learning recommendations across retail business lines | AWS reports click-through rates up 600% and average order value up nearly 26% versus the prior approach | Large retailers with broad catalogs or multiple brands |
| Bydee | International market and customer context | Shopify reports average order value up 26% and global sales revenue up 189% over two years; other factors may have contributed | Brands expanding into international markets |
Turning These Examples Into a Personalization Plan You Can Test
Seven examples, one pattern. Each brand changed a specific surface on a specific signal and measured the result against a baseline. None of the wins came from switching on a personalization platform and hoping. And one thing worth keeping in perspective: most of the reported lifts come from platform-published case studies, so treat them as evidence a tactic can work, not as a forecast for your store.
Here is the sequence I'd run at a mid-size store.
Pick one page. Your homepage or your top collection page, whichever carries more traffic. Expand only after the first test holds.
Pick one signal. Browsing intent, purchase history, or a declared preference. Pick exactly one. If you're starting from nothing, declared preference is safest because shoppers volunteer it and you can explain why you asked. That's the practical version of what zero party data means, and it scales further than expected.
Set the baseline first. Two weeks of clean data on conversion rate, average order value, and revenue per visitor before anything ships. Skip this step and every result becomes an argument about noise.
Run a holdout. Keep a persistent control group rather than relying on a before-and-after chart, because one promotion or seasonal spike wrecks that comparison. Measure the funnel in stages too. Black Dog's ecommerce personalization breakdown summarizes a randomized field experiment across 184,375 users where personalized recommendations lifted product views by 15.3%, conversion conditional on viewing by 21.6%, and overall conversion by 7.5%. The gap between those numbers is the story: discovery moves first, purchase follows.
Judge on repeat purchase. A module that lifts clicks while order value stays flat has bought you nothing. Write down the threshold you'd need before you keep the change, and hold yourself to it.
One more surface is worth planning for. AI assistants are becoming a discovery channel, and Deloitte's 2026 consumer research reports that 63% of consumers used AI-powered search tools or assistants to find products or services in the preceding year, with one in five now starting a search with an AI tool rather than a search engine or brand site. Personalization on that surface runs on clean product attributes, accurate stock, and profiles that respect consent.
If you're deciding which test to run first, an outside read helps. Up North Media builds custom e-commerce web applications, runs automated email campaigns for retention and seasonal promotions, and offers conversion rate optimization and automated content creation, so the team can map a first test against your traffic, catalog, and current data before you commit to another platform. Visit Up North Media to start that conversation.