
Search for advice on first touch vs last touch attribution and the answer arrives in near-identical wording from every direction: last touch is broken, first touch is vanity, and the fix is to switch to a multi-touch or data-driven model. The recommendation sounds decisive. It also skips the only question that changes a budget, which is which decision you're trying to make.
Both models are correct rules. First touch and last touch apply deliberately different formulas to the same set of conversions, so they redistribute responsibility for a sale rather than measure different sales. Neither one demonstrates that a channel caused anything. A campaign that appears to drive a third of revenue under one rule and almost nothing under the other hasn't changed its behavior. You changed the question.
What follows is a working method, not a verdict. Read what each model credits, see where the measurement settings bend the numbers, test the channels where the two views disagree, and only then move money.
First Touch and Last Touch at a Glance
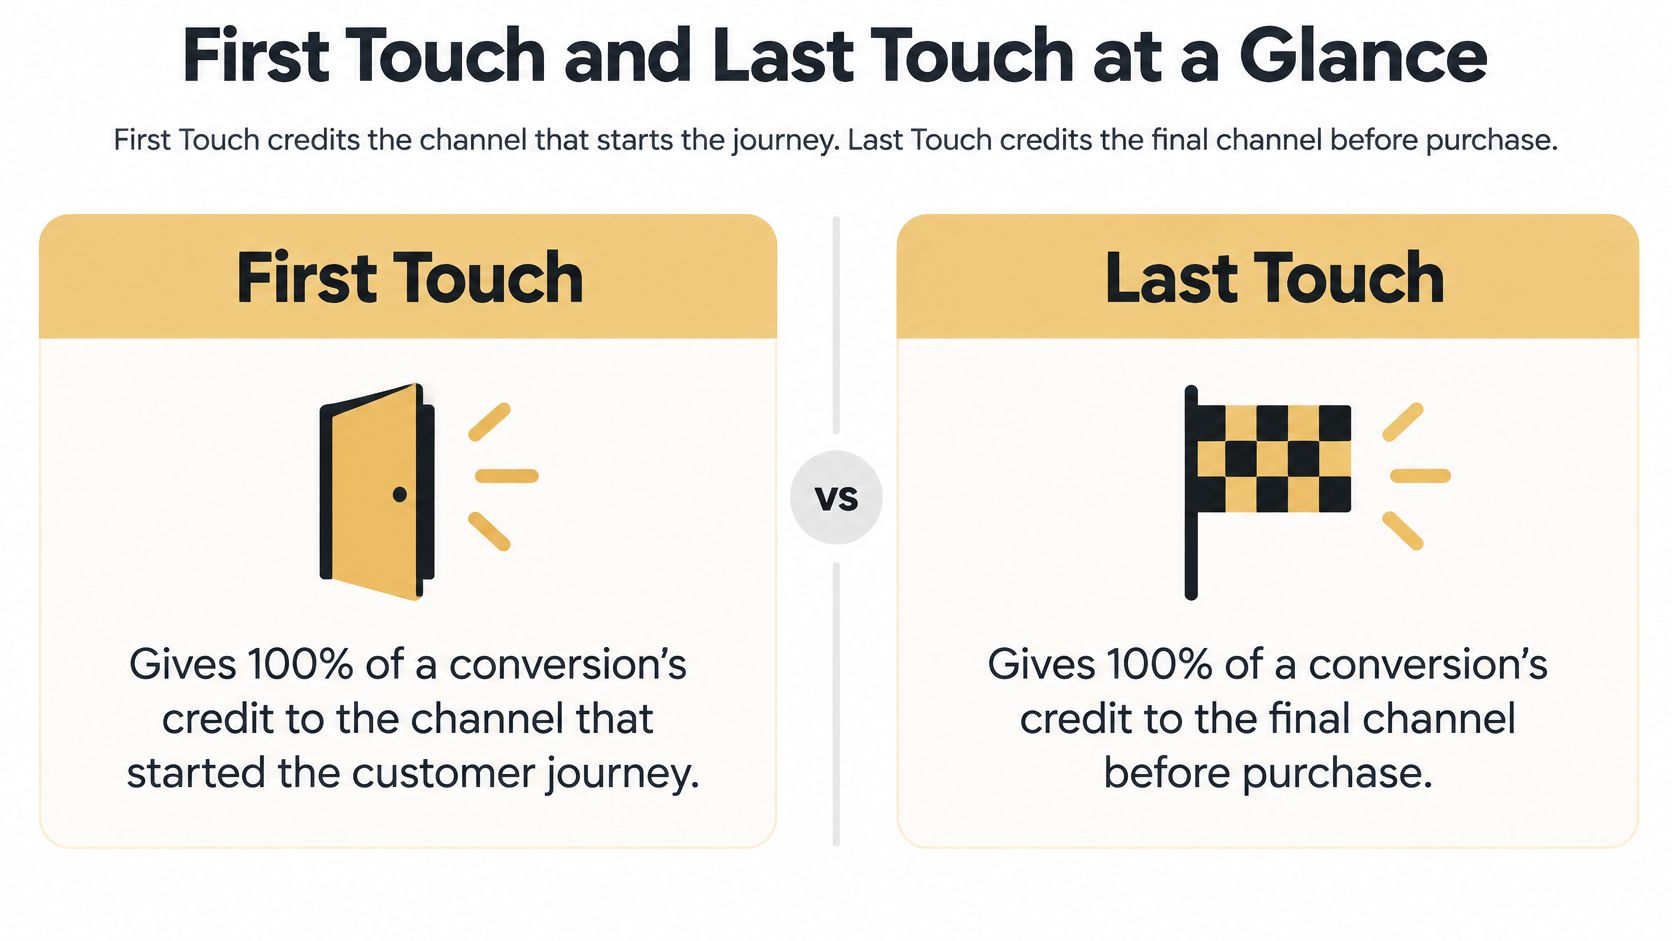
First touch gives 100% of a conversion's credit to the channel that started the customer journey. Last touch gives 100% to the final channel before the sale. Both are deliberate rules applied to the same conversions, which is why one sale can look like a content win under one rule and a branded-search win under the other.
| Question | First touch | Last touch |
|---|---|---|
| Which interaction gets 100% of credit | The first interaction in the customer journey | The final interaction before conversion |
| Question the model answers | What creates demand and awareness | What captures and closes the sale |
| Main blind spot | Ignores what closed the deal | Ignores what created the demand |
| Channels it tends to inflate | Content, paid social, display, SEO discovery | Branded search, direct visits, retargeting |
| Most sensitive to | Lookback window and path definition | Direct-traffic handling and branded search capture |
The infographic below condenses the two definitions into a single frame.
Read the last two rows together and the pattern is hard to miss. Whatever a channel does well is the thing its favored model rewards, and whatever it does badly disappears from the report. A content program, a display placement or a prospecting campaign rarely appears as the closing touch, so last touch treats it as decorative. Branded search, direct visits and retargeting rarely start journeys, so first touch treats them as minor. Neither reading is a tracking error. Each is a consequence of where the rule points.
The one-line rule: use first touch to study acquisition, last touch to diagnose conversion capture, and treat neither as a complete revenue truth.
What the pair gives you is a diagnostic instrument. When the two views disagree about one channel, the size of the disagreement tells you where that channel sits in the journey, which is information neither report contains on its own.
How Each Model Credits the Same Customer Journey
Take a path with four steps. A customer discovers a retailer through organic search, returns later through social media, receives an email, and converts on a direct visit. According to Google Analytics attribution documentation, the first-interaction model assigns 100% of the conversion's value to the channel that initiated the journey, so organic search takes the entire sale. The last-interaction model assigns 100% to the final channel immediately preceding the conversion, so the direct visit takes it instead. Social and email receive nothing under either rule.
The arithmetic gets clearer with Google's historical Multi-Channel Funnels example, which uses a four-touch path of paid search, social, email and direct traffic. Under a linear model each touch receives 25%. Under first- or last-interaction attribution, one touch receives 100% and the rest receive zero.
| Touchpoint | First-touch credit | Last-touch credit | Linear credit |
|---|---|---|---|
| Organic search (discovery) | 100% | 0% | 25% |
| Social media (return visit) | 0% | 0% | 25% |
| Email (nurture) | 0% | 0% | 25% |
| Direct visit (conversion) | 0% | 100% | 25% |
What the totals actually say
Total revenue is identical in every column. Only the allocation moves. That matters because allocation is what ends up in a budget meeting, and a channel that looks like a rounding error under one rule can look like the largest line item under another without a single additional sale taking place.
The models also have different management uses, which Google's documentation states directly: first touch evaluates demand creation and awareness, last touch evaluates the interaction most closely associated with closing the sale. Neither captures the influence of the middle steps, so a comparison of the two should be read as a signal about journey structure rather than as proof that a channel generated all the demand.
Treat a large gap between the columns as a location, not a verdict. It tells you the channel sits near the start or the end of the path.
When you export conversion paths and sort them by channel, look for the channels that appear in one view and vanish in the other. Those are your candidates for a proper test. Mapping the steps first, with a structured customer journey mapping exercise, gives you the vocabulary to name what each touch is doing before you argue about credit.
Which Funnel Stage Each Model Favors
The first decision criterion isn't which model is better. It's where your channels sit.
First touch favors anything that opens a relationship: search discovery, organic social, content, partnerships, prospecting and awareness campaigns. It rewards the work of being findable. Last touch favors anything that sits near the transaction: branded search, email to people who already know you, retargeting, direct visits, a sales call booked from a pricing page. It rewards the work of being chosen.
Where first touch earns its keep
- New-customer visibility: it shows which sources introduce people who have never bought from you, which is the only view that answers an acquisition question.
- Channel experiments: when you launch a placement or a sponsorship, first touch tells you whether it puts new names into the funnel at all.
- Budget defense for top-of-funnel work: content and SEO rarely close deals directly, and last touch alone will keep arguing to cut them.
Where last touch earns its keep
- Conversion capture: it shows the sequence that ends in a purchase, which is useful for landing pages, checkout, offers and cart recovery.
- Fast feedback: for short cycles, the closing touch appears within days, so you can adjust within a week instead of a quarter.
- Direct-response accountability: a retargeting campaign that produces no closing touches is not working.
The drawbacks mirror the strengths. First touch gives no credit to nurture and closing, and it happily credits awareness that never converts. Last touch over-credits branded and direct demand that another channel created, and it systematically undervalues content and SEO.
Say a SaaS company runs a free trial. Blog articles introduce most new visitors, and branded search closes most sign-ups. Under first touch the content team looks like the growth engine. Under last touch the brand terms do. The honest reading is that the brand terms are harvesting demand the blog built, and any decision made from one report alone will be wrong about half of the mechanism.
Practical test: ask which channel would stop bringing new demand into the funnel if you switched it off, and which would stop capturing it. Whichever question you just answered is the model you should be reading.
How Lookback Windows and Direct Traffic Shift Results
A first-touch report and a last-touch report answer different questions only when they share the same path rules. Change the lookback window, the treatment of direct traffic, or how a path is defined, and channel rankings move even if the journeys did not. Attribution still only redistributes credit among the touchpoints those settings leave visible.
In paid-and-organic last click, direct traffic is ignored and 100% of key-event value goes to the last eligible non-direct channel, as Google Analytics' attribution settings guidance explains. Direct receives credit only when the entire path consists of direct visits. The key-event lookback window sets how far back a touchpoint can earn that credit. A short window drops upper-funnel channels whose influence landed weeks or months earlier. A long window can pin the sale on an interaction that has already gone stale. Neither result is more correct. Each one answers a different question about the same observed path.
Google also removed first-click, linear, time-decay and position-based models from the current Analytics interface, and data-driven attribution is now the default. Teams that still want a first-touch view have to rebuild it from exported paths or a warehouse model. That rebuild is useful only if the settings stay frozen. A model switch cannot repair a mismatched window.
| Setting | Effect on first touch | Effect on last touch |
|---|---|---|
| Short lookback window | Undercounts channels that introduced the customer weeks or months earlier | Favors the final interactions close to purchase |
| Long lookback window | Credits interactions that may have been stale | Can credit an old interaction as if it closed the sale |
| Direct traffic counted as a channel | Rarely changes results, because direct is seldom a first touch | Direct takes credit for conversions other channels started |
| Direct traffic excluded (paid and organic last click) | Little effect on discovery channels | Credit moves to the last eligible non-direct channel |
| Cookie loss or cross-device paths | Early touchpoints go missing, so first channels are undercounted | The final touch on a new device may get credit it did not earn |
Freeze the settings before you compare
Write down four things and keep them identical across every report you intend to compare: the lookback window, the identity resolution rules, the channel grouping taxonomy, and how direct traffic is treated. Change any one of them and you have measured the setting, not the channel.
Bookkeeping channels suffer most from that drift. Consider email attribution for hospitality venues, where a guest opens a message on a phone and books on a laptop days later. The click and the booking land on different devices, and both first and last views can miss the middle. Consistency plus a documented reconciliation step beats a cleverer model.
Then measure sensitivity rather than absolutes. For each channel, record how much attributed revenue moves between first touch, last touch and data-driven reporting. If a channel's ranking flips when a single setting changes, the conclusion is fragile and should not drive a budget. Use first touch to ask who introduced demand inside the window you fixed, and last touch to ask who closed inside that same window. Solid measurement foundations, covered in this guide to analytics implementation, remove more noise than any model switch will.
Why Neither Model Proves What Caused a Sale
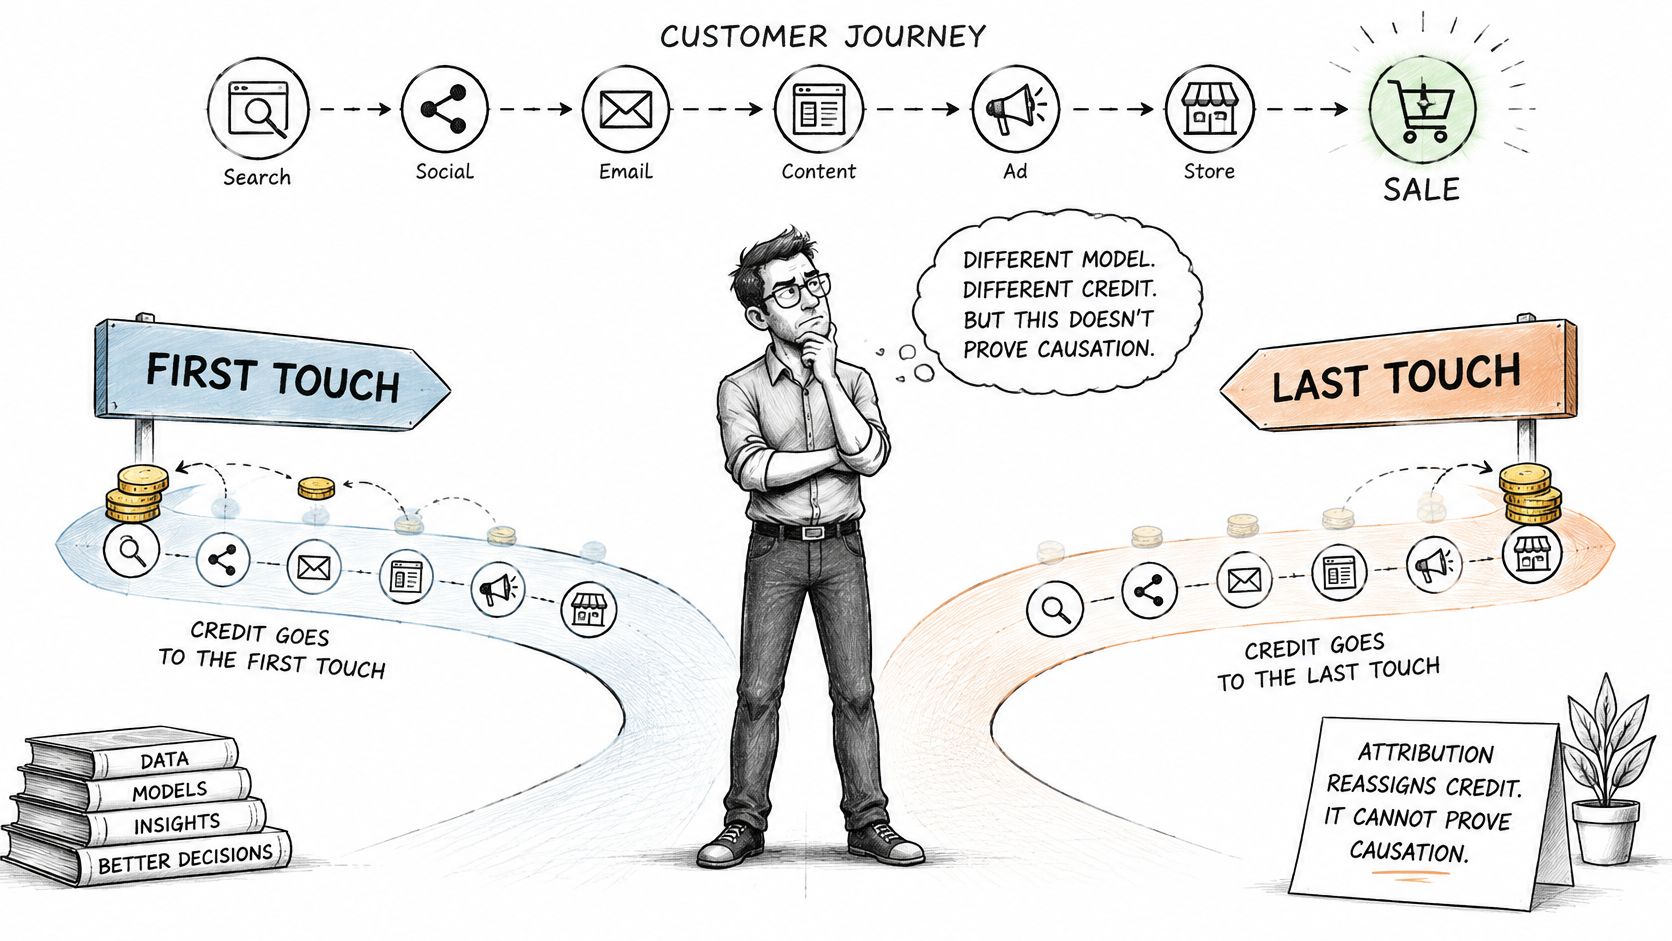
Ranking a channel first only means the model assigned it the most observed credit. Attribution redistributes that credit among touchpoints the tracker recorded. Anything that never entered the dataset stays outside the report, and a multi-touch model cannot invent value for conversions it never saw. Incrementality research treats the gap as an observability problem, not a defect that belongs only to last click.
The distance between the two readings can be large. For the same activity, one published comparison puts an incrementality estimate at 15.4 and a last-touch estimate at 5.5, in this analysis of attribution and incrementality. Platform-reported credit can understate a real effect, or warp it, by a margin that cleaner reports will not close.
Branded search is the tell
Branded search and direct traffic make the gap concrete. Neither creates much demand on its own. Both show up after a journey that began somewhere else. Last touch still books them for the sale they closed, so a team that funds the top of that report will bid more on its own name and cut the work that made people search for it.
The useful output is a shortlist of disputed channels.
Decision rule for disputed channels: use first touch to study demand creation, last touch to diagnose conversion capture, and a controlled lift test or holdout to decide whether either one generated incremental revenue.
Run the holdout on a fixed window. Pull the channel from one region or one audience segment, keep spend and seasonality as steady as the calendar allows, and compare the change in conversions with what the model predicted for that same period. If the model said the channel produced 40 conversions and the holdout cost you 12, the model was generous. Building an audience large enough to test against is a discipline of its own, and it matters most when the disputed channel is social: this guide on how to build genuine social audiences for DTC is the practical companion for that case.
Which Model Fits Your Business Situation
Most readers recognize themselves in one of five situations. The verdict for each is short, and the check that follows it matters more than the verdict.
| Situation | Lean toward | Why | Check next |
|---|---|---|---|
| Launching a new paid channel to find buyers | First touch | Shows which source introduced new customers | Compare with last touch for the same period |
| Mature store with heavy branded search and direct traffic | Last touch, used with caution | Shows what closes sales, but branded search may harvest existing demand | Run a holdout on branded campaigns |
| Long consideration cycle driven by content and SEO | First touch plus assisted view | Content often introduces buyers that last touch undervalues | Review assisted conversions by channel |
| Short-cycle lead generation with CRM data | Last touch | Fast feedback on conversion-path efficiency | Reconcile with CRM stage data |
| Small team with inconsistent tracking | Neither as the lead model | Fragile settings produce unreliable totals | Freeze UTM and lookback rules first |
The first row is the one people get wrong most often. When you're paying to find out whether a new channel can produce customers at all, acquisition is the whole question, and last touch will punish the channel for every sale that closes elsewhere. Run both views for the same period and look at new-customer counts, not revenue share.
For the mature store, caution is doing real work in that verdict. Last touch on a business with strong brand recognition mostly measures how good the business already is at being remembered. The holdout on branded campaigns is the only way to separate the value of owning the brand term from the value of bidding on it.
Long cycles invert the problem. If content introduces buyers who convert months later, a first-touch view plus assisted conversions gives you a defensible estimate, and last touch gives you a systematically biased one.
For small teams, the constraint is data quality rather than model choice. A 2025 global survey of 200 marketers found that 57% expected attribution to become more difficult, citing privacy limitations, data silos, budget constraints and insufficient expertise, as Forbes' agency council coverage reports. For Omaha businesses running lean teams, that pressure shows up as untagged campaigns and mismatched CRM fields long before it shows up as a modeling problem. Before choosing a model, fix the plumbing and review how you're measuring marketing campaign effectiveness end to end.
When first touch and last touch tell opposite stories about one channel, you've found your test case. Picking the model you prefer is not a resolution.
Build a Hybrid Setup Before Your Next Budget Review
A budget review does not need a winning model. It needs a frozen setup, views that answer different questions, and one test of whether a disputed channel moves revenue. Attribution only redistributes credit among observed touchpoints. The sequence below is a decision rule, not a claim that any model is correct.
It takes one reporting cycle to build. It pays for itself the first time a budget question is answered with a test instead of a preference.
- Freeze the setup. Lock the lookback window, direct-traffic treatment, channel grouping and UTM rules, and write the values down so the next report is comparable.
- Pull three reports for the same period. First touch, last touch and data-driven, exported from the same dates and settings.
- Record the gap per channel. Note where the models agree and flag every channel where they disagree by more than the margin you're willing to ignore.
- Test the most disputed channel. Run one holdout or geographic lift test and compare the result with what the model predicted.
- Publish confidence levels. Separate observed conversions from modeled ones so nobody reads a modeled figure as a receipt.
- Review quarterly and reconcile with CRM revenue. If the CRM says one thing and the attribution report says another, the CRM is usually closer to the invoice.
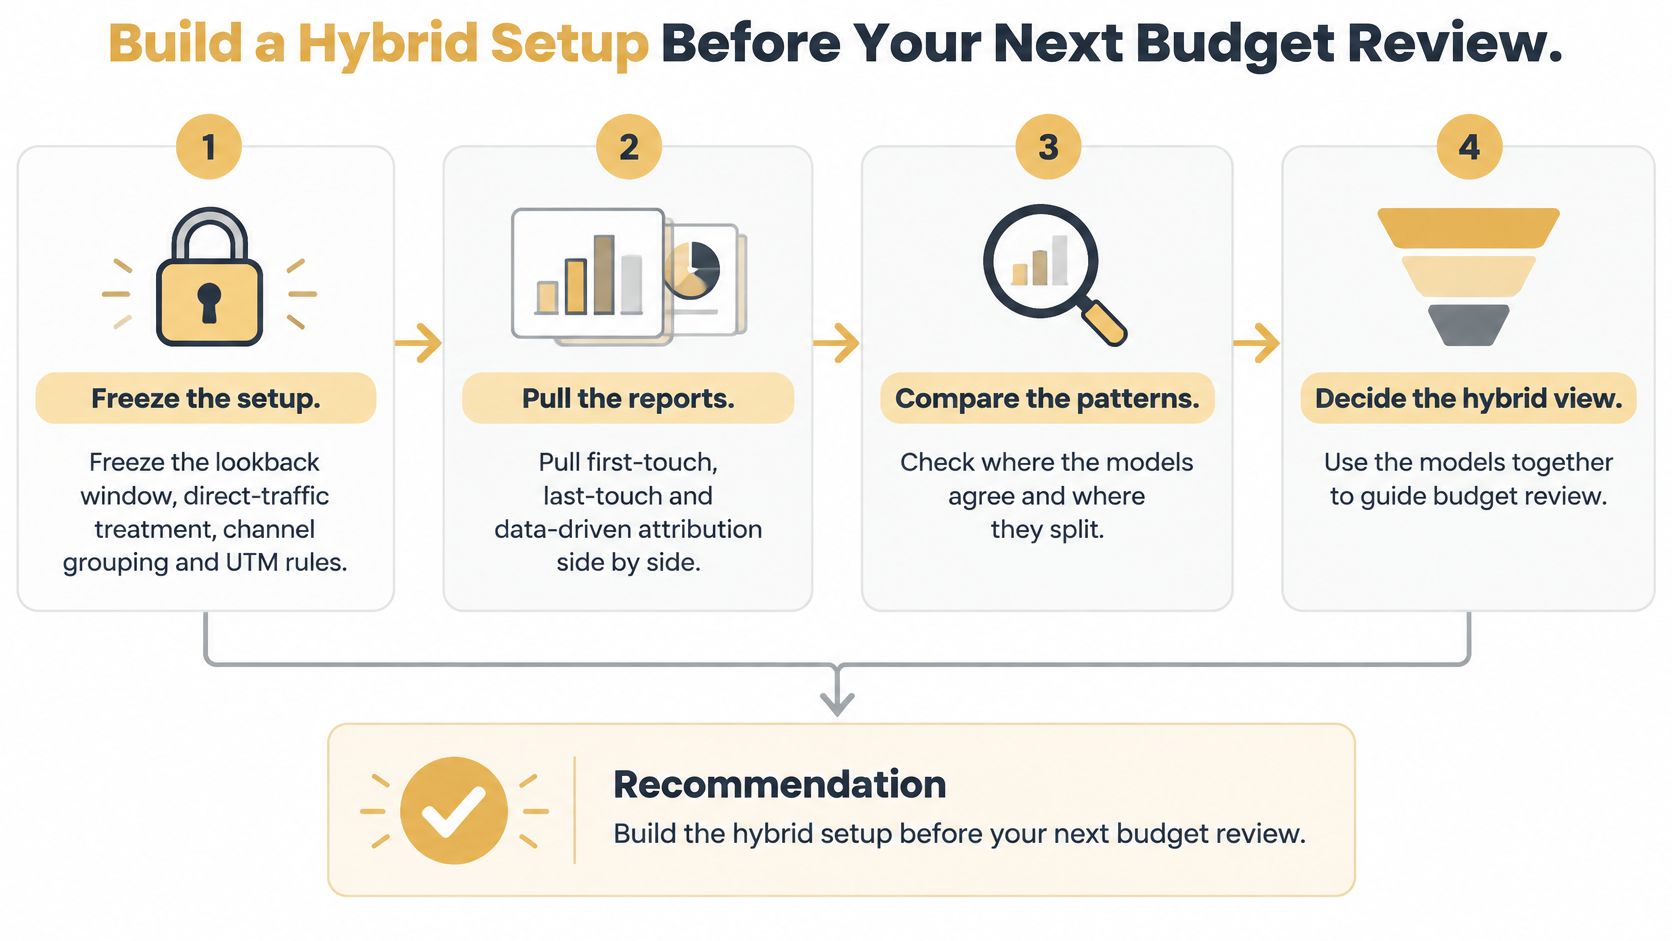
Steps 1 through 3 only make the disagreement visible. Step 4 is the causality check. A holdout or geographic lift test asks whether withholding the channel changes conversions. If lift is near zero while last touch still assigns that channel a large share, the model was moving credit around, not measuring cause. Steps 5 and 6 stop a modeled figure from being read as an invoice.
Keep last touch and data-driven views as operational reports. They are stable, fast, and they answer who closed. Use first touch when the question is who arrived, which is the right input for an acquisition budget. Let an incrementality test settle any channel where those views disagree. Each view stays tied to the question it can answer. The test covers the question none of them can.
The video below covers the practical framing of the trade-offs.
At kickoff, Up North Media gathers the client's real buyer queries, target competitors and the markets that matter, which gives the channel list a factual starting point rather than a guess assembled from a tool's default categories. A free 60-minute strategy call, bookable through the agency's website, is enough to review the current setup and decide which channels go on the test list first. Visit Up North Media to book that call before the next budget review.