
Ask ten people how to automate reporting and nine will tell you to pick a platform, connect every source, and build a dashboard. That order is backwards, and it's why so many small teams end up with a polished Monday email that finance refuses to sign off.
Automation doesn't fix a definition problem. It moves the argument from "why is this late" to "why doesn't this match the commerce admin," which is worse, because now the wrong number arrives on time and everyone forwards it.
The first win is smaller than a dashboard. It's one governed report with block-send checks, where a scorecard picks the report, a pipeline produces it, and a set of gates decides whether it goes out. One number the team can defend in a meeting beats twelve charts nobody trusts.
Which Reports Deserve Automation First
A store owner spends Monday morning rebuilding the same sheet. Orders come out of the commerce admin, spend comes out of two ad accounts, refunds get matched by hand, and the total gets pasted into a template. Finance opens it, says the number is wrong, and nobody can name the stale export or the formula that got dragged one row too far.
That's the report worth fixing first, and the deliverable is a scorecard, not a tool. Score every candidate report from 1 to 5 on six things before you evaluate a single vendor.
- Rebuild frequency: how often someone rebuilds it from scratch. Daily is a 5, quarterly is a 1.
- Hours per cycle: honest clock time, including the reconciliation that happens after the email has already gone out.
- Cost of a wrong number: what a bad total costs in refunds, over-ordering, or a decision reversed two weeks later.
- Decision impact: whether anyone changes a price, a budget, or a hire because of it.
- Data stability: whether source fields and category mappings hold still between cycles. Churn in SKU categories or account mappings drags this score down hard.
- Sensitivity: whether the file leaves the building, touches tax, or gets forwarded to a customer or a lender.
Threshold: automate first only when a report scores 20 or higher and data stability is at least 3. Below that, you're automating an argument.
The adoption picture explains why so many teams stall. The 2025 NFIB technology survey found that 24 percent of small-business owners were using AI, while only 4 percent reported using or planning to use it for process automation and 14 percent for business or predictive analysis. That gap is a business-case problem, not a skills problem: most owners can't name the report that would pay for the work.
| Report | Usual cadence | Hours each cycle | Automate first when |
|---|---|---|---|
| Daily orders and refunds | Daily | 1-2 | Store export is stable and one person owns exceptions |
| Weekly channel return on ad spend | Weekly | 2-4 | Order IDs and ad-account IDs already match |
| Monthly inventory aging | Monthly | 3-5 | SKU categories are signed off and do not change mid-month |
| Executive profit and margin | Monthly | 4-8 | Account and product mappings are stable; otherwise wait |
| Customer cohort lifetime value | Monthly | 3-6 | Customer identity is already resolved across store and email |
Three e-commerce starters clear the bar most often: daily orders and refunds, weekly channel return on ad spend, and monthly inventory aging once category assignments are signed off. A monthly profit pack usually doesn't, even when the meeting feels more important. Circle one row and carry only that report forward.
Build the Reporting Pipeline in Seven Moves
One report, one number, one owner per stage. Every move below exists to keep a single agreed figure reproducible on demand, so the scorecard that chose the report and the gates that guard its send are aimed at the same output. The dashboard is what you build last, after the number can defend itself.
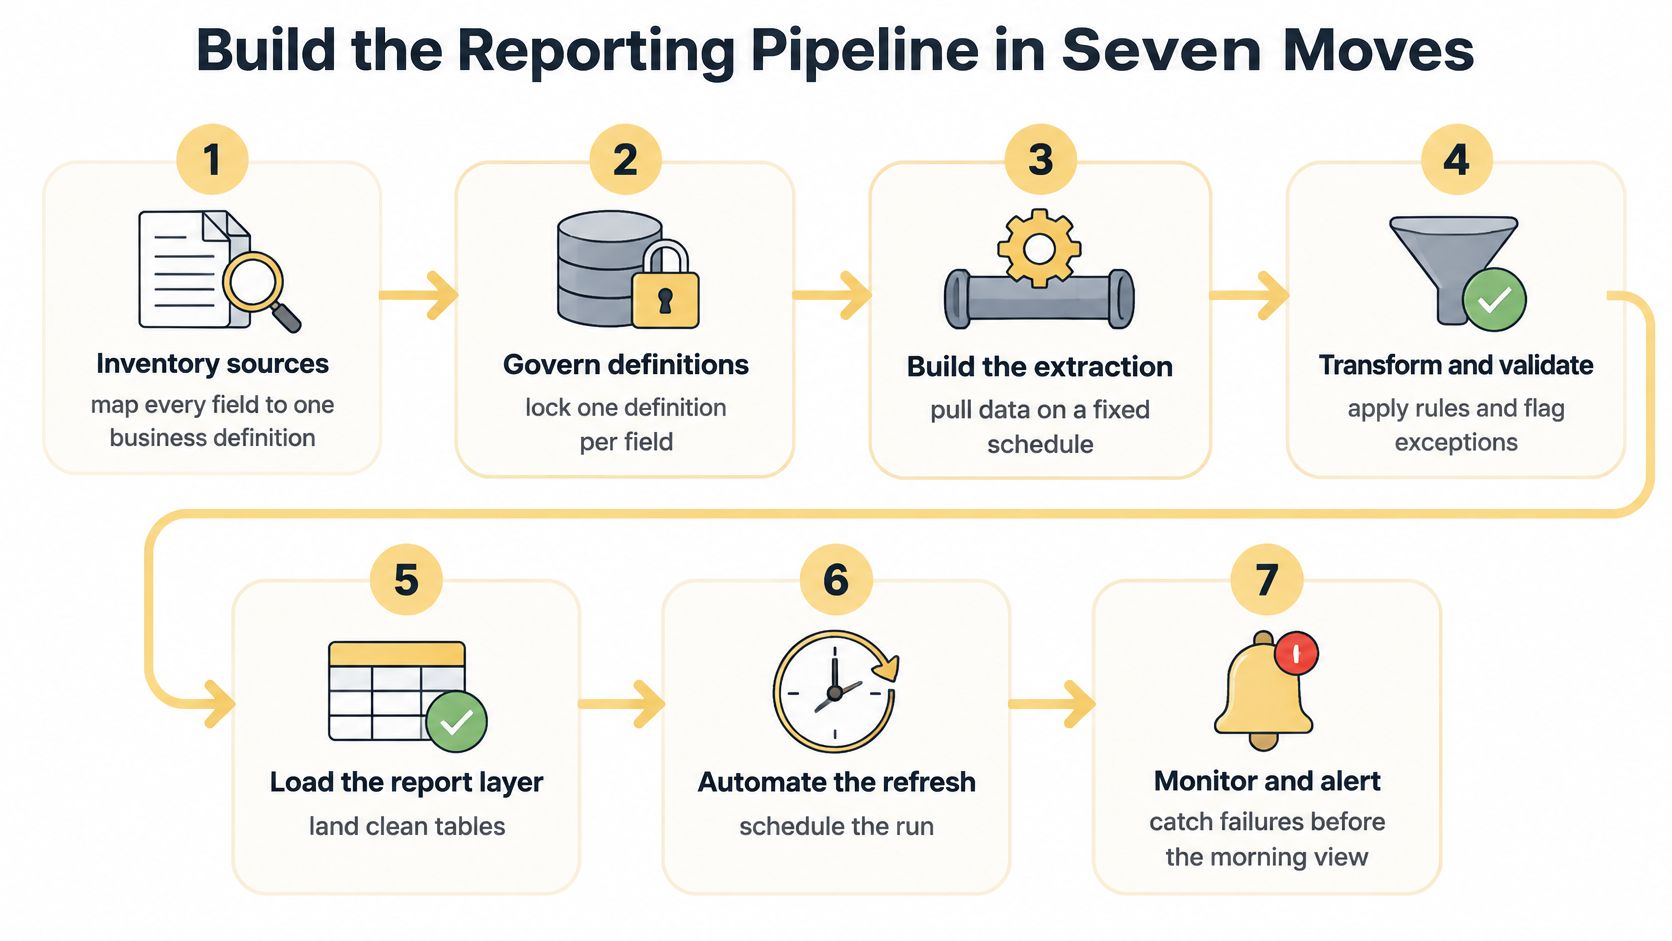
1. Inventory every source and state the grain. Order line, order day, campaign day, one row per customer. A store that mixes order-level refunds with campaign-level spend gets a return-on-ad-spend figure that never reconciles, no matter how clean the chart looks.
2. Ingest through a connector or a scheduled extract. Manual downloads are where silent drift starts: someone saves last week's export over this week's file, and nothing in the process notices.
3. Validate at ingestion. Check completeness, uniqueness, type conformity, freshness, referential integrity, and business-rule consistency before any transformation runs. When the ad account starts returning nulls after a currency change, the pipeline should stop, not print zero spend and let the email go out.
4. Normalize identifiers and categories. One campaign named two ways splits its spend in half. "Meta_BF" and "Meta BF" become two channels, and the profitable one reports like a loser.
5. Transform into a small reporting model and version every formula. One owner per KPI, with the formula and the grain written down. Otherwise a dragged cell redefines average order value for the whole team and leaves no audit trail.
6. Publish only when the gates pass. The schedule proposes the send; the checks dispose it. The failure is a 7am email that fires on time while the freshness check is still red. A blocked send is a feature, and I would rather explain a late report than a wrong one.
7. Pilot for several cycles against a reconciled baseline. For a store, that means last week's orders and refunds checked against the commerce admin totals, not a full profit-and-loss rebuild. Add a second source only after the first survives a few cycles clean.
The order matters because every stage trusts the output of the one before it. Normalizing campaign names fixes nothing if ingestion dropped half the rows, and a freshness check means nothing until the grain is fixed, because completeness measured on the wrong unit just confirms the wrong table. Define the number before you automate it, and make it trustworthy before you let a scheduler send it.
Keep lineage so any number can be reproduced
Preserve source-to-report lineage, transformation versions, timestamps, and an audit log. The failure worth naming is fast delivery with informal definitions: the email arrives, someone asks why the total moved, and no one can answer without rebuilding the sheet by hand. Lineage turns that question into a quick lookup instead of a lost afternoon, and it is the only reason a second report can reuse the first report's numbers instead of re-deriving them.
If a walkthrough helps more than a numbered list, this video runs the same sequencing at a slower pace.
Finance teams run a variant of this workflow with a close calendar attached. This CEFCore reporting automation overview is a useful read for how the reporting layer sits next to the monthly close rather than replacing it.
Choose a Tool by the Job It Must Do
A tool can't rescue a report you haven't specified. Judge every option on four questions: how many sources it must touch, who maintains it after month two, whether formulas are versioned, and whether a failed refresh is visible to someone who will act on it.
Settle the architecture before any purchase. The pattern that holds up at any size is programmatic ingestion feeding a reusable output layer: connect to the source, retrieve on a schedule, calculate the measure once, present it wherever it is needed. That shape is identical for a two-export spreadsheet and a warehouse. Start at ingestion, keep the output standardized so the same validated calculation can feed a dashboard, a client summary, and an alert.
The first win is one governed report with block-send checks. Pick the lightest tool that gets that single number out the door with a gate in front of it.
Pick the lightest stack that one named person will actually maintain. A governed spreadsheet beats a warehouse nobody logs into.
Spreadsheet with a scheduled refresh. Fits one or two exports and a weekly audience while an analyst still owns the logic. Cheapest start, easiest to audit, and the failure mode is invisible formula drift, because the cell still shows a number and the number still looks plausible.
BI tool with native connectors. Fits three to eight stable apps and readers who want a chart rather than a PDF. The risk is metric sprawl: two users build "revenue," one includes refunds, and the meeting debates which chart is right.
Small warehouse plus a transformation layer. Fits five or more systems that must agree on what an order or a customer is. It is the right answer once definitions are settled and an expensive distraction while they are still being argued about in the profit meeting.
Integration tool for handoffs. Moves files on a schedule and does it well. It replaces no metric layer, so the calculation still lives somewhere unmanaged.
| Approach | Best when | Who maintains it | Main risk |
|---|---|---|---|
| Spreadsheet with scheduled refresh | One or two exports and a weekly audience | The analyst | Formula changes nobody can see |
| BI tool with native connectors | Three to eight stable apps and dashboard readers | Analyst plus a tool admin | Duplicate metrics with different names |
| Small warehouse plus transformations | Five or more systems sharing definitions | A data owner or a partner | Overbuild before definitions exist |
| Integration tool for file and app handoffs | Moving data point to point only | An operations generalist | No governed metric layer at all |
None of these wins on merit. A two-person marketing team with no analyst should not buy a warehouse, and a retailer running five systems across store, marketplace, and three ad platforms will outgrow a spreadsheet within a quarter. The scorecard, the pipeline steps and the quality gates all exist to serve a single number the team can trust; the tool is the cheapest reliable way to deliver it. Hold off on any generative writing step until the numbers are stable, because a fluent paragraph about an unverified total is harder to catch than a wrong cell.
Design the Pack and Set the Delivery Clock
Design the output after the numbers are governed, not before. A pack that answers three questions beats a dashboard that answers none, and each view should answer exactly one.
For a store, the shapes look like this.
- Morning view, weekdays: are yesterday's orders and refunds inside a normal band? Exceptions and counts, not every row.
- Monday view: which channel paid back last week. Three metrics and a link back to the model.
- Month-end view: which inventory is aging. A PDF that goes to the owner only after the close checklist passes.
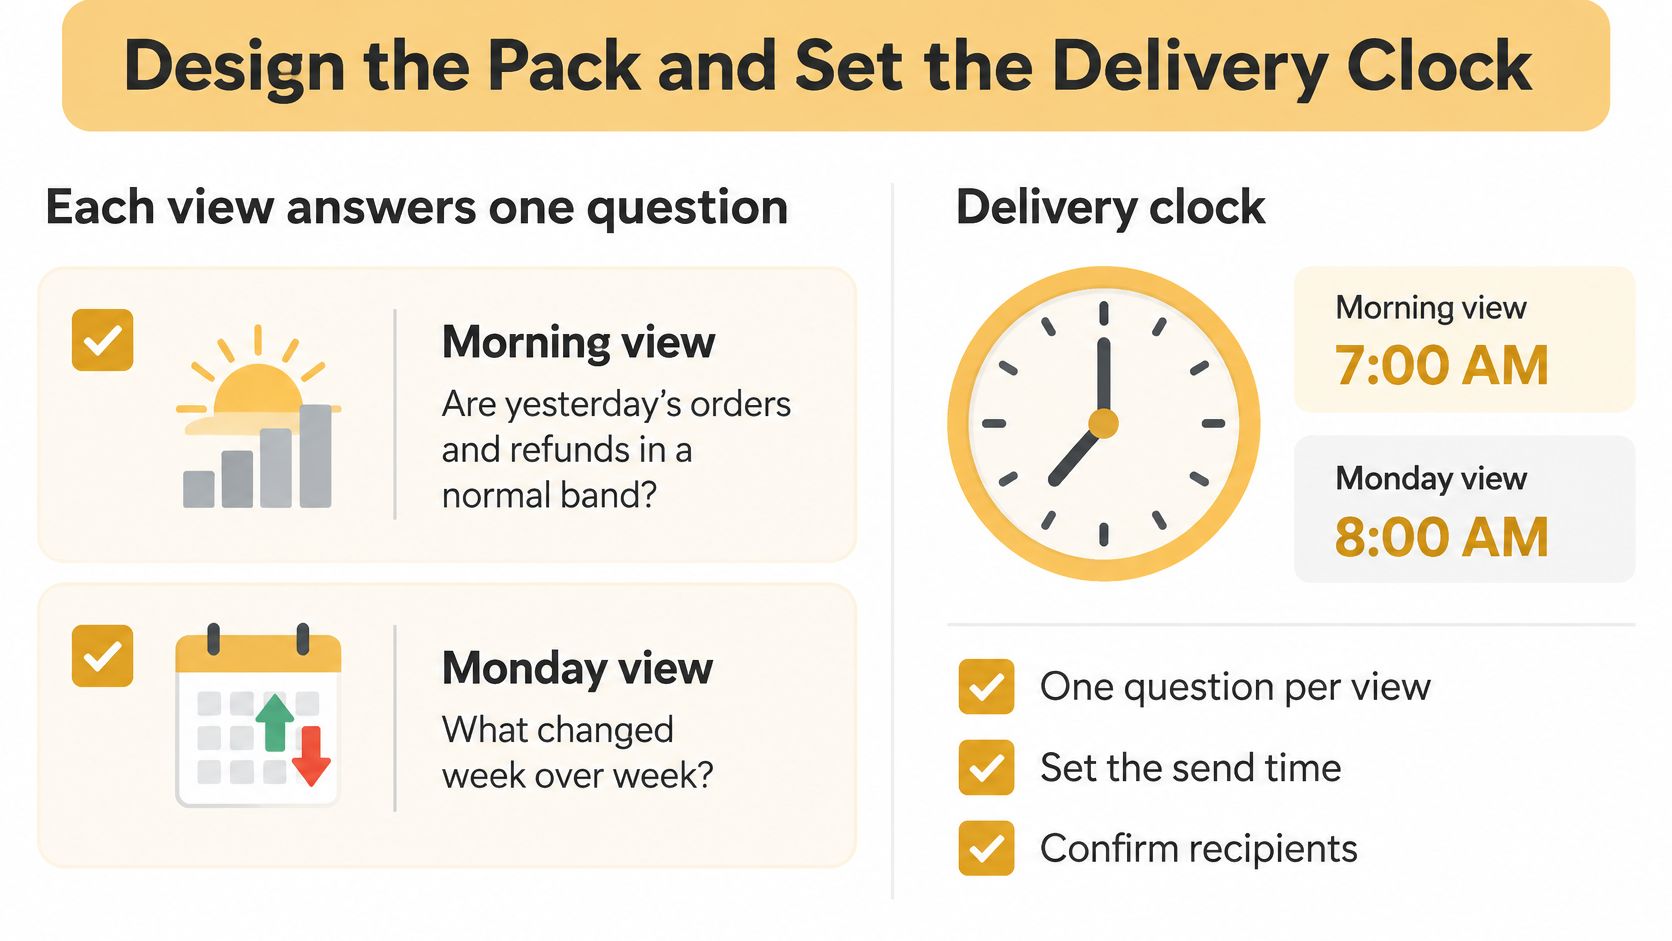
Put the comparison period on the page every time: versus last week, versus the same weekday last year. Call out exceptions instead of dumping rows, and label the grain on every view so nobody reads a campaign-day figure as an order-day figure. Use the same validated calculations for all three outputs, or the Monday email will eventually disagree with the dashboard and both will lose credibility.
Every send carries a source timestamp. A report that says "data as of 04:12" saves an hour of "is this current" messages.
When a human has to approve
Practical rule: define the variance before launch, in numbers, and let the routine pack auto-send. Hold only the exception. If refund rate or ad spend moves outside the agreed band, the pack waits for the KPI owner.
Split delivery by audience rather than by convenience. Operations gets a live link in the business timezone, marketing gets a short summary with three metrics, the owner gets the PDF after close. Schedule the daily operational refresh, the weekly management summary, and the monthly close as three separate jobs with three separate failure routes, so a broken weekly job doesn't take down the morning view.
Two things stay manual for now: narrative commentary that explains why a number moved, and any forecast that still depends on hand-edited categories. Automating either one just makes a guess arrive faster.
If the marketing view pulls from web analytics, a proper Google Analytics KPI dashboard gives you the metric layer to point at. And teams in regulated settings face a harder version of this problem: this guide to building a HIPAA-compliant revenue dashboard shows how much further access scoping and audit trails have to go when the audience isn't internal.
Quality Gates, Access and Governance
A report can be delivered on time and still be wrong. On-time delivery is a schedule metric. Quality is a separate instrument, and the one that matters is error-escape rate: the proportion of incorrect or stale outputs that reach a person.
The gap here is real and measurable. An ISG Research assessment of 68 data-management providers scored data pipelines at 1.19 and data governance at 1.28 on automation, the two lowest areas it measured. Everyone bought dashboards. Almost nobody automated the checks that make a dashboard believable.
Technical monitoring guidance for automated pipelines recommends tracking duration, failure rate, data volume, freshness, and throughput, and pairing ingestion assertions with orchestration alerts, centralized logging, and automated tests (published in the IJCTT). Set targets a small team can review monthly: 99 percent of scheduled sends on time, every run schema-validated, and zero publication when a critical check fails.
| Check | Fail when | Action |
|---|---|---|
| Freshness | Source is older than its refresh deadline | Quarantine the pack and alert the owner |
| Row count | Volume moves materially off the rolling baseline | Hold publish and compare to the source |
| Duplicates | The same order or customer key appears twice | Merge on the stable key; do not append |
| Schema | A required field is missing or a new field appears | Stop the run until the mapping is updated |
| Business range | Refund rate, AOV, or spend leaves the agreed band | Route to the KPI owner for approval |
| Formula change | Metric logic changed without sign-off | Revert to the last signed version |
On any failure, quarantine the output, alert a named channel, and leave the last good pack visible. Avoid leaving a vacuum, because someone may fill it by rebuilding the report in a private spreadsheet, creating a second version of the truth.
Retries are not a quality strategy
A retry duplicates orders unless the load is idempotent. Use stable keys and merge semantics, or your "recovered" run doubles a day of revenue and nobody notices until the refund report.
Rank sources by trust. A commerce admin export outranks a manually edited promo sheet every time, and the promo sheet needs stronger reconciliation before it's allowed to move a headline number. For financially material reports, keep an audit trail that can't be overwritten, and log the run ID, error code, and a sample of failing records so the fix starts from evidence.
Access is part of the pipeline
One named owner per KPI, separate credentials instead of a shared login, read rights scoped to each audience, and sign-off before any formula changes. Mask customer-identifying fields in anything that travels beyond the operations team. If you're still standing up the analytics stack these jobs run on, planning the analytics implementation matters as much as the report spec, because retrofitting governance onto a live dashboard is the most expensive way to do it.
A Worked Weekly Report Spec
Here's the template, filled in, before anyone opens a connector builder. Copy it, replace the values with your own, and build only against what's written down.
| Spec field | Example value |
|---|---|
| Report | Weekly channel return on ad spend |
| Owner | Marketing lead signs off formula |
| Sources | Commerce order export and ad-account exports |
| Join keys | Order ID and ad-account ID |
| Grain | Campaign-day |
| Formula version | v1.0, locked at kickoff, changes only with owner sign-off |
| Block rule | Unmatched ad-account IDs above the threshold set from the first clean runs |
| Freshness | Order export older than 24 hours on a Monday send |
| Spend band | Outside the band set from the trailing four-week range |
| Send | Monday summary email with dashboard link and source timestamp |
Campaign-day is the grain because ad platforms report spend by campaign by day. Roll to order-day and a customer who clicked two campaigns gets counted twice, which inflates attributed revenue and makes every channel look like a winner.
The block rules are the part people skip and later regret. An unmatched ad-account ID means a campaign is running under an account nobody mapped, so its spend exists and its revenue doesn't. Publishing anyway produces a channel that looks free.
Set the thresholds from your own history rather than a template. A few weeks of clean runs give you a spend band and a freshness limit that catch genuine breaks without paging someone every Monday morning. Until those numbers exist, leave them as open questions in the spec, not guesses in the code.
Judge the Payoff and Start One Report
Judge the pilot on more than hours deleted from the calendar. Track five results for that one report: preparation hours no longer spent, days cut from the decision cycle, reconciliation differences that disappeared, late sends avoided, and buying or forecast mistakes the cleaner number prevented. Then subtract tool fees and the hours spent keeping connectors alive, which is a real line item people leave out of the business case.
Partial automation is the realistic outcome, and it still pays. In the McKinsey CFO Pulse results reported by CFO, only 1 percent of CFOs had automated more than 76 percent of their finance processes, while 79 percent said they had automated at least 25 percent more processes during the previous 12 months. Almost nobody finishes. Plenty of teams get real value from the first slice.
AI pilots tend to run ahead of the plumbing underneath them. A team demos a model that drafts commentary on the numbers, then discovers the numbers still arrive unreconciled. The AI layer pays off only when the pipeline feeding it already passes the same block-send checks the report does.
Set the keep-or-kill review date before launch and use your own pre-automation hours as the baseline. Then extend the pattern to other workflows before adding sources to this one. The same staged logic applies if you push further into AI-powered business process automation: standardize definitions, automate collection, validate outputs, then automate delivery. If your industry requires documented controls, the Premiere Education article library is a continuing-education resource on recordkeeping standards worth skimming before you finalize the spec.
This week, run the scorecard, pick the single report scoring 20 or higher, and write its owner, formula, and block-send rule on one page. One governed report is the whole play. The scorecard picks it, the pipeline feeds it, and the quality gates protect a single number the team can finally trust.
Up North Media's AI consulting practice covers workflow automation and chatbots that integrate with your existing CRM and support systems, so the build fits how your team already works. Typical AI consulting clients see ROI within 6 to 12 months, with some reaching 200 to 300 percent returns through improved efficiency and new revenue streams. If your one-page spec is written and nobody owns the connectors, visit Up North Media to scope the build.