
The usual advice for an SEO reporting template is to start with rankings, add traffic charts, and finish with a list of completed work. That produces a tidy deck, but it doesn't necessarily help an owner decide where to spend next month's budget. Start with the decisions instead: whether search brought the right visitors, whether those visitors became customers, and which pages or tracking gaps need attention.
What a Useful SEO Reporting Template Decides
An owner opens a monthly deck and sees improving average positions. The agency has highlighted winning keywords, the traffic chart points upward, and the work log lists new content. Then the owner asks whether qualified calls or orders improved, and nobody can answer without opening another system.
The problem isn't missing charts. It's a report designed around what an SEO tool exports rather than what the business needs to decide.
A useful SEO reporting template is a repeatable monthly or quarterly layout that connects search visibility, on-site behavior, and business outcomes. Unlike a one-off audit, it preserves the same reporting structure so the reader can distinguish progress from a change in presentation.
Build around decisions, not exports
Say an Omaha service business attracts more visitors to an informational guide while its main service page produces fewer qualified enquiries. A sitewide traffic chart could make that month look successful. A decision-focused report separates the guide from the service page and asks whether the next task should be content expansion, a service-page revision, or a booking-flow fix.
The reporting shell needs to support different readers:
- Owners need the commercial result, the uncertainty around it, and the decision requiring approval.
- In-house marketers need defensible comparisons and enough detail to coordinate sales, content, and development.
- Agency leads need evidence that connects recommendations to specific pages, search demand, and business priorities.
Local services, ecommerce shops, and publishers can use the same basic structure. What changes is the outcome that counts, not the need for a clear source and comparison.
Make the report usable without a meeting
Keep a copyable block map, a consistent set of Search Console measures, and separate rules for property totals and page rows. Add an outcomes block that distinguishes existing brand demand from discovery, plus an AI-search log that doesn't manufacture click rates.
The report should also distinguish observation from explanation. A page lost clicks is an observation. A page lost clicks because its title changed is a hypothesis until you've checked the timing, query mix, and competing explanations.
Done test: Every reported number has a source, a comparison, and a sentence explaining what to do next.
End with named owners and deadlines. If the reader understands what changed but can't tell who's responsible for the response, the template hasn't finished its job.
Report Blocks to Copy Into Every Monthly Deck
| Report block | What to include | Source | Compare against |
|---|---|---|---|
| Executive summary | One win, one loss, and the actions | All sources below | Last month and same month last year |
| Search visibility | Clicks, impressions, CTR, average position | Google Search Console | Prior period and year over year |
| Query and page detail | Non-branded queries and landing pages | Search Console query and page reports | Page-level figures, not property totals |
| On-site behavior | Organic sessions and engagement | Analytics organic segment | Acquisition metrics kept separate from on-site metrics |
| Business outcomes | Leads, revenue, assisted conversions, pipeline | Analytics plus CRM | Target and year over year |
| AI search log | Tracked questions, citation yes or no, cited competitors | Manual log plus available Search Console Generative AI view | Prior snapshot of the same questions |
| Technical health | Indexation, speed, schema, open issues | Crawl and Search Console | Issues still open from last report |
| Next actions | Owner, deadline, and the page or query affected | Report notes | This month's roadmap |
Read the blocks as a decision sequence
Write the executive summary last, even though it appears first. State the meaningful win, the meaningful loss, and the response. Compare performance with the previous month and the same month last year, but don't turn the summary into a compressed spreadsheet.
The search visibility block establishes whether search exposure and resulting clicks changed. Keep the core measures together so a ranking improvement doesn't conceal a loss of traffic. Add commentary only where the movement affects a decision.
Use query and page detail to identify the actual work. Group landing pages by purpose, such as service, category, product, or editorial pages, and separate discovery queries from searches containing the business name. Don't paste an unfiltered export into the deck and expect the owner to identify the opportunity.
The on-site behavior block starts after acquisition. Sessions and engagement help you investigate what visitors did after arriving; they aren't interchangeable with Search Console clicks. A Google Analytics KPI dashboard can support this view, provided the dashboard preserves the organic segment and uses the same event definitions each month.
Keep commercial evidence and maintenance visible
The business outcomes block should show the result against a target, not just against the previous period. For a roofing company, that means connecting demand to qualified enquiries rather than treating all visits as equally valuable. The Bluelight roofing advertising findings are a useful companion resource when discussing roofing acquisition alongside SEO, but keep paid acquisition evidence separate from organic results.
The AI-search log records observed answers and citations. It's an evidence log, not another traffic dashboard. Keep it compact enough that someone can repeat the checks consistently.
For technical health, report unresolved issues that affect important pages, not every warning a crawler produces. An unintended indexing restriction on a service page deserves different treatment from a low-priority structured-data warning on an archived article. Record the affected page group, business risk, owner, and status.
The next-actions block closes the loop. Replace improve content with a concrete task, such as revise the emergency-service page to clarify coverage and booking options. Include the person responsible, the deadline, and the evidence that justified the task.
Keep this block order stable. Change the commentary and priorities each month, not the report's basic navigation.
Clicks Impressions CTR and Average Position
A page with 10,000 impressions and 300 clicks has a 3% CTR, while a page with 2,000 impressions and 100 clicks has a 5% CTR, using the clicks-divided-by-impressions calculation defined in Google's Search Console Performance documentation. The second page attracts clicks more efficiently despite receiving less exposure, but the first still delivers more clicks.
That distinction is why a visibility block needs clicks, impressions, click-through rate, and average position together. No individual measure tells the whole performance story.
| Measure | Definition | Example reading | Do not treat it as |
|---|---|---|---|
| Clicks | Times users select the site from Search | More selections mean more search-generated traffic | Proof of revenue |
| Impressions | Times the site appears in results | More appearances mean broader exposure | Proof the listing is appealing |
| CTR | Clicks divided by impressions | A higher share of appearances results in clicks | A ranking by itself |
| Average position | Average rank of the topmost result for recorded impressions | Ranking context for changes in exposure or CTR | The only success metric |
Interpret the measures as a group
Impressions describe exposure. If they increase while clicks remain flat, investigate where the additional appearances came from. New informational queries, different countries, or less competitive positions may explain the change without indicating that an existing listing became worse.
Clicks describe traffic generated from Search. A click increase is useful acquisition evidence, but it doesn't tell you whether visitors needed the service, could buy the product, or completed an enquiry.
CTR describes the share of impressions that produced clicks. It can help identify a listing worth reviewing, but don't automatically blame the title when CTR falls. First check whether the page started appearing for a different query mix or in different positions.
Average position supplies ranking context. It isn't a fixed daily rank for an individual keyword. Read it beside the other measures and inspect the relevant query and page combinations before recommending a rewrite.
Segment before assigning a cause
Search Console lets you group performance by query, page, country, and device. Those cuts help you distinguish a sitewide concern from a specific market or landing-page problem.
For example, a golf club should separate searches about joining from searches about course information. GolfRep's guide to turn local searches into membership enquiries provides useful context for connecting local search work to an enquiry-led objective. The reporting decision is then whether the membership page is attracting relevant demand, not whether the entire site gained impressions.
Use a short investigation sequence:
- Check the page. Identify which landing page changed, rather than relying on the sitewide average.
- Check the audience. Compare country and device segments that matter to the business.
- Check the query mix. Separate newly visible searches from established queries.
- Choose the response. Review listing copy, content relevance, internal links, or the conversion path according to the evidence.
Keep all the measures in the visibility block. A rankings-only chart can support diagnosis, but it isn't an outcome report.
Property Totals Versus Page Level Numbers
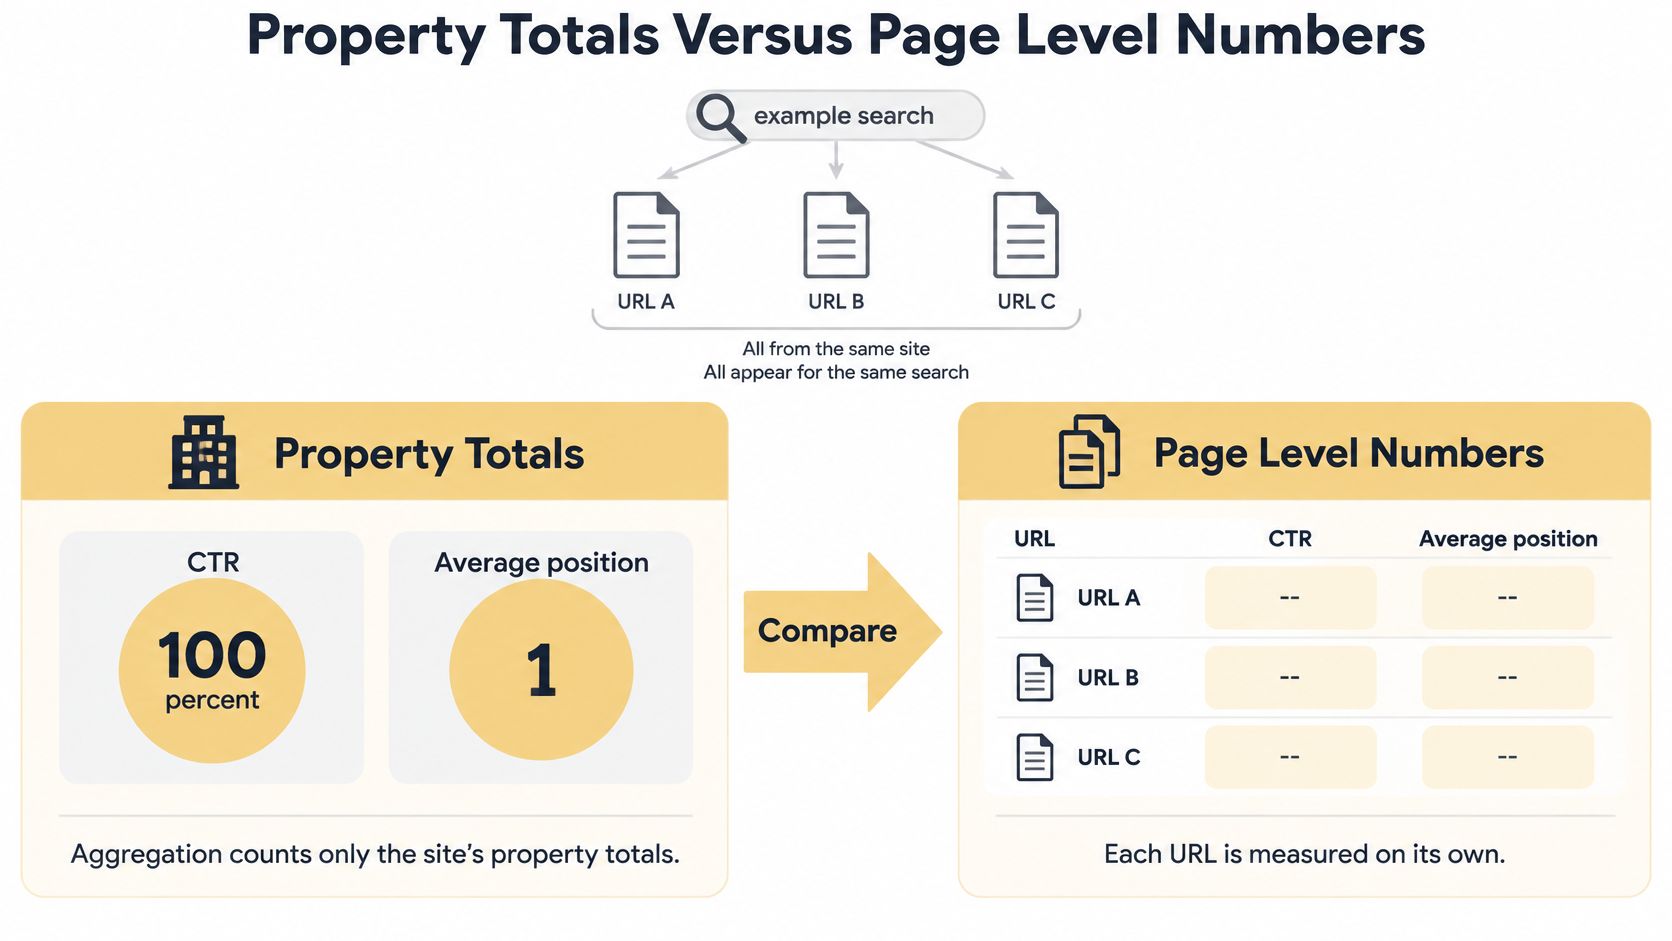
Consider a search where several URLs from the same site appear. At the property level, the site is evaluated as a property; at page level, each URL contributes its own observations. That means a property summary and a page export can describe the same search activity differently without either being broken.
The important distinction isn't another analytics-history milestone. It's knowing what the reporting system is counting before combining search acquisition with on-site activity, the separate measurement role described in the Google Analytics overview.
The comparison below illustrates why a property summary should never be treated as an individual URL's result.
Label the unit before reading the trend
Property aggregation uses the site's topmost result for position and combines impressions at the property level. Page aggregation evaluates individual URLs. Changing between those views can create an apparent improvement or decline that isn't a change in search performance.
Make the unit visible in the table heading or footnote:
- Property total belongs on the overall exposure line in the executive view.
- Page row belongs in the optimization table used to decide which URL needs work.
- Filters and dates should accompany either view, including the search type and any country or device restriction.
Don't describe a URL's CTR as improving or worsening relative to the property CTR. Compare the URL with its own earlier performance under matching filters.
A different aggregation level is a different measurement, not a performance change.
Separate search acquisition from website activity
Keep organic clicks and impressions in the visibility block. Put sessions and engagement in the behavior block, with conversions and revenue in the commercial view. Each needs its own source label, date range, and comparison period.
Don't force Search Console clicks to equal analytics sessions. Investigate disagreement by checking scope, filters, tracking configuration, and aggregation before proposing a strategy change.
A useful handoff note might say that the service-page row uses page-level Search Console data, while the summary uses property totals and the behavior table uses an organic analytics segment. That short methodological note prevents the next analyst from treating unlike figures as interchangeable.
The trade-off is a little more labeling. The benefit is avoiding a confident recommendation based on a comparison that should never have been made.
Conversions Pipeline and Branded Demand
Rising organic traffic isn't automatically a business win. Growth driven by existing brand demand, informational readers, or visitors outside the buying market can leave revenue unchanged; flat traffic can still accompany stronger lead quality or larger deals. Digital Success's SEO reporting guidance also identifies last-click attribution as a weakness because it can undervalue SEO's role in starting or influencing a buying journey.
Treat the business-outcomes block as a commercial explanation, not a trophy cabinet for traffic growth.
| Outcome row | What it shows | Split or note | Weak if omitted |
|---|---|---|---|
| Non-branded clicks and conversions | Discovery rather than people who already know the name | Keep branded rows separate; label how discovery conversions are identified | Brand demand looks like SEO growth |
| First-touch conversions | Journeys SEO started | Name the attribution window | SEO looks ineffective when another channel closes |
| Assisted conversions | Journeys SEO influenced | Don't add them to last-click totals | Influence disappears |
| Qualified-lead rate | Leads sales accepts, not raw form fills | Define qualified using the CRM stage | Volume hides poor leads |
| Pipeline value | Open opportunity tied to organic landing pages | Use CRM value, not session counts | Traffic growth hides small deals |
| Revenue by landing-page group | Money associated with category, product, or service pages | Compare year over year, not only month over month | An isolated winning page hides a weak site |
Don't imply more attribution than you have
Separate branded and non-branded query clicks using a maintained brand-term definition. Include the business name, recognizable variations, and relevant product brands according to the reporting objective.
Conversions need more care. Don't imply that an analytics conversion can be joined to an individual Search Console query unless your measurement setup supports that connection. If discovery conversions are classified through landing-page groups or another proxy, label the method explicitly.
First-touch, assisted, and last-click views answer different questions. They aren't additional sales you can sum into a larger revenue total. Use them to understand how search contributes to the journey, then use the accounting or CRM revenue definition for the actual business result.
For a plumber, a report that counts only form submissions misses enquiries made by phone. For an ecommerce shop, last-click revenue alone can overlook category pages that helped a buyer choose before returning through another channel.
Put the limitations under the table
Add a data-quality note covering consent-related measurement loss, CRM matching, the attribution window, and offline outcomes. Name which calls, store visits, or repeat purchases are included, excluded, or unavailable.
Compare outcomes with business targets and the same period last year. If tracking changed, flag that change before interpreting the trend.
Commercial safeguard: Show what you can attribute, explain what you can only infer, and never present the two as equally certain.
Gym Membership Tips' explanation of how to calculate return on gym ad spend offers a useful adjacent budgeting perspective, but paid-media return and organic return need separate cost definitions. For the organic calculation, use a consistent SEO ROI measurement approach that names the investment included and the revenue attribution used.
Keep these rows in the business-outcomes block. Adding revenue beside impressions doesn't fix attribution; defining the relationship does.
AI Search Citations Without Invented Clicks
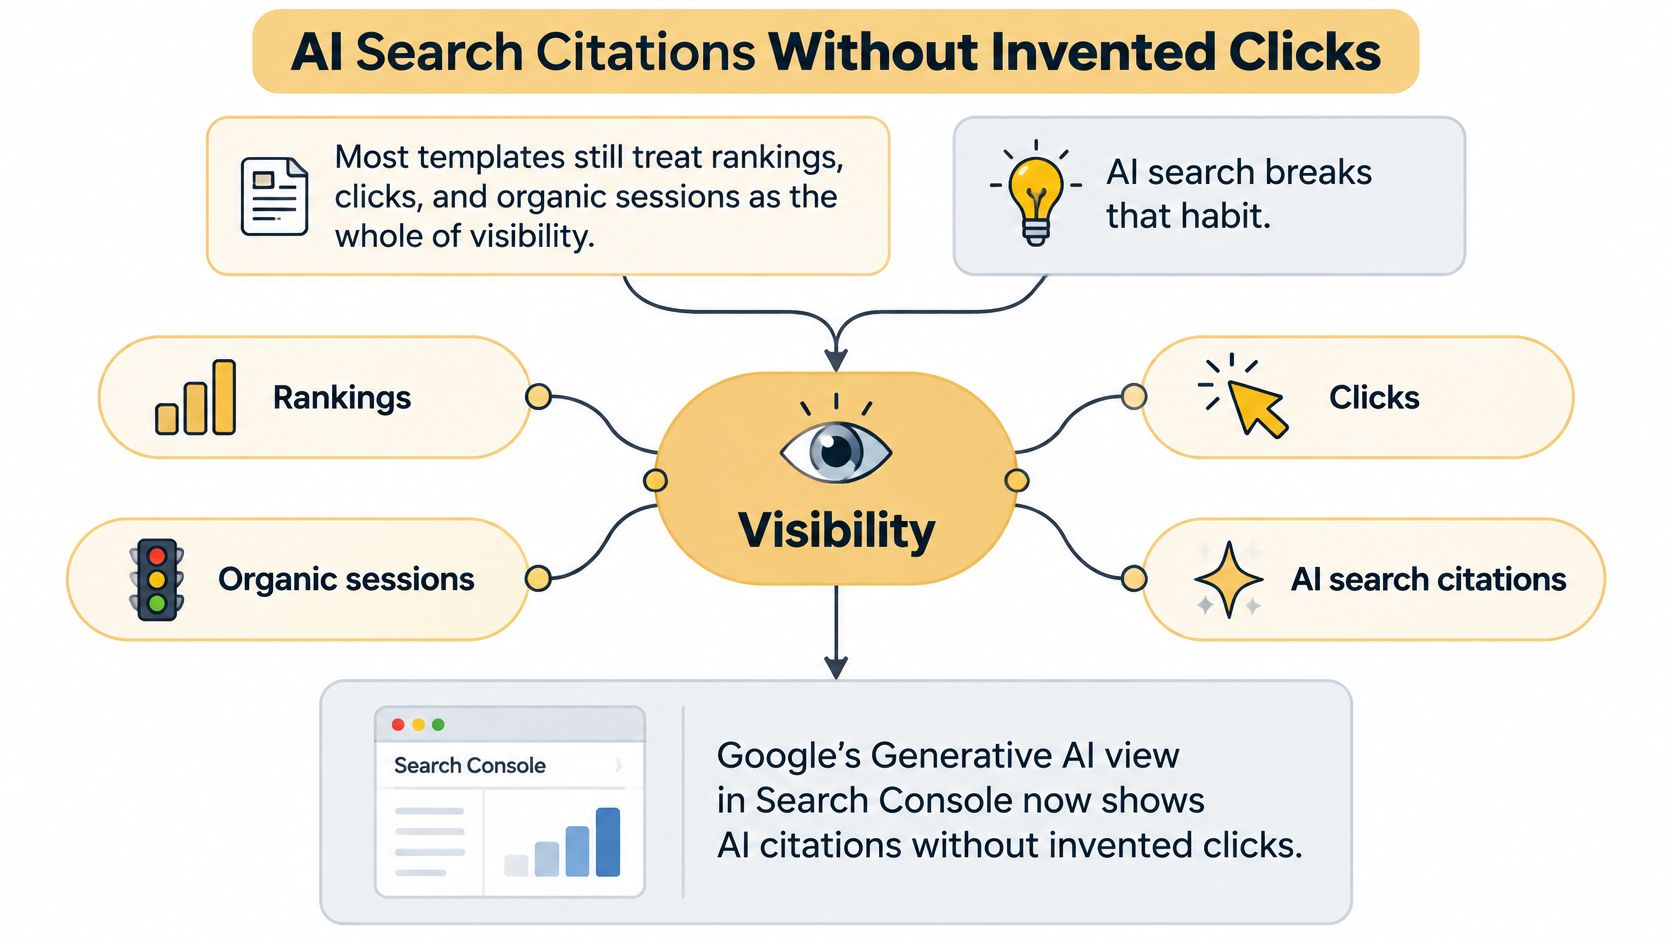
Don't calculate an AI-query CTR without AI-query clicks. Search Engine Journal's coverage of Google's AI click reporting describes a Generative AI view containing AI Overview and AI Mode impressions, but not query-level clicks, CTR, or conversion data. It also describes AI interactions being aggregated into standard Web reporting, which limits clean separation from conventional organic visits.
That leaves a reporting gap, not permission to estimate missing clicks from citations. Record observed visibility separately from measurable traffic.
The visual below distinguishes the visibility signals that a conventional traffic dashboard can blur together.
Maintain a repeatable question log
Choose a fixed set of buyer questions that correspond to valuable pages. A service business might check questions about availability, service coverage, and choosing a provider. A retailer might check comparisons that relate to its category pages.
Record the following fields:
- Observation details include the date, platform or search surface, country, and device.
- Question and answer type preserve the exact wording and whether the answer compares options, recommends providers, or explains a process.
- Citation evidence records whether the business was cited, which page appeared, and which competitors or other sources were included.
- Evidence capture stores a screenshot and a brief note about the answer.
- Measured outcome records identifiable referral behavior or a downstream conversion only when the tracking supports it.
Use the same markets and question wording for repeat checks. If you expand the question set, distinguish the new questions from the continuing baseline so a larger sample doesn't masquerade as better visibility.
Keep awareness separate from commercial impact
A citation can establish that the business appeared in an answer. It doesn't establish that someone clicked, remembered the brand, or purchased.
Similarly, a measurable referral from an AI platform doesn't prove which exact prompt produced the visit. Preserve the referral evidence you have without assigning it to an unverified question.
For businesses planning structured work around this channel, generative engine optimization services should be evaluated against a documented baseline and observable changes, not a promised substitute for revenue reporting.
Use the accompanying video as supporting context while keeping the question log as the repeatable deliverable.
When a measurable lead follows an identifiable referral, record it in the outcomes block using the same attribution rules as other channels. When no conversion can be measured, leave that conversion cell blank and add a measurement-status note. Blank means unavailable, not no commercial value.
A manual log is less convenient than an automated score, but it keeps the distinction between observed citation, measured visit, and attributed outcome intact.
Local Ecommerce and Content Cuts of the Same Template
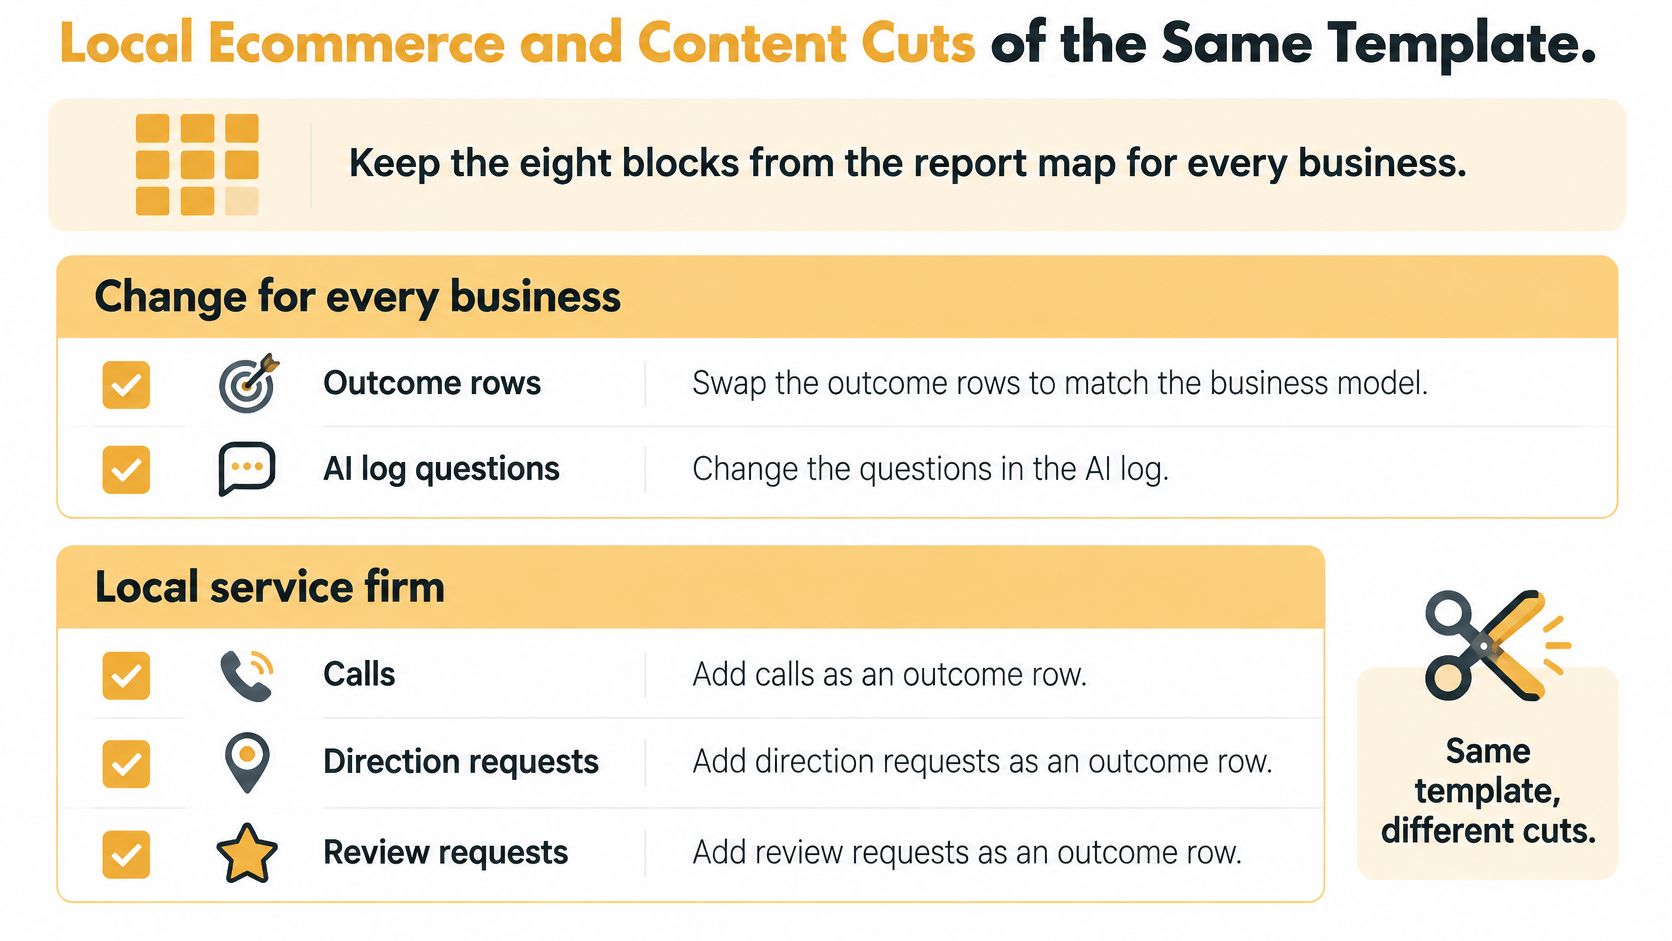
Keep the report blocks consistent across business models, then change the outcomes and buyer questions. A local contractor, an online retailer, and a publisher shouldn't need completely different reporting systems. They do need different definitions of valuable demand.
The customization guide highlights the fields that change without replacing the reporting structure.
| Business type | Extra outcome rows | AI question set | Timing note |
|---|---|---|---|
| Local service | Calls, direction requests, and review velocity beside form fills; Google Business Profile queries for the service area | Service-plus-city questions | Profile movement can appear in 2 to 4 weeks, with a fuller read in 3 to 6 months |
| Ecommerce | Revenue and assisted revenue by category and product templates; branded queries separate from category discovery; country rows with sessions but no orders | Product-comparison questions | Compare year over year so seasonality isn't treated as a strategy win |
| Content or publisher | Engagement and non-branded queries feeding subscription or affiliate pages | Topic questions | An informational impression spike isn't a commercial win |
Local service reporting needs an intake view
For a local firm, distinguish website forms, tracked phone enquiries, and profile interactions. A direction request is evidence of intent, not proof of a completed visit or sale. Review requests belong in the work log; newly received reviews and review velocity belong in the reputation view.
Match Google Business Profile queries to the actual service area. If an Omaha business gains interest from places it doesn't serve, flag the mismatch rather than celebrating the exposure.
Allow the comparison period to match the work's maturity. Early profile movement deserves an operational update, while a revenue conclusion needs enough time and reliable intake tracking. Don't treat an early visibility improvement as a guaranteed commercial result.
Ecommerce and publishers need different page groups
For ecommerce, group results by category and product templates. Category discovery and searches for a known product can require different content, merchandising, and conversion responses.
Investigate countries that generate sessions without orders. Check delivery coverage, currency presentation, product availability, and audience relevance before deciding the traffic is useless. Keep assisted revenue labeled so it isn't added to directly attributed revenue.
For publishers, group informational articles separately from subscription, affiliate, or other commercial pages. Engagement can help diagnose reader interest, but the relevant outcome is whether those readers reach and act on the monetization path.
Use topic questions in the AI log that reflect the publication's expertise. Don't populate it with broad questions the site has no editorial or commercial reason to answer.
The operating checklist stays compact: same blocks, business-specific outcomes, labeled aggregation, year-over-year comparison, and buyer questions that match how the organization makes money.
Fill the Template This Month
Build the first report manually enough to understand the definitions before automating exports. A dashboard can repeat a mistake just as reliably as it repeats a good calculation.
Follow a fixed fill routine
-
Lock the reporting periods. Write the current date range, the preceding comparison, and the same period last year on the sheet before exporting. Check that each connected tool is using the intended period.
-
Paste the report blocks. Keep their order stable and label visibility tables as property totals or page rows. Add the source and relevant filters to each table.
-
Enter the Search Console measures. Bring in clicks, impressions, CTR, and average position together. Preserve the underlying exports so someone can verify the summary.
-
Complete the commercial rows. Add the branded-demand split, conversion views, qualified-lead rate, pipeline, and revenue by landing-page group. Put the target beside the result and document unavailable attribution.
-
Update the AI-question evidence. Record citation observations, competitors, answer type, country, and device. Leave unmeasurable conversions blank rather than filling the gap with assumptions.
-
Write the executive judgement. Name the win, the loss, and the action after checking the detail. Give the action an owner, deadline, and affected page or query group.
-
Apply the business-specific cut. Add the local, ecommerce, or publisher rows without rebuilding the deck. Check that operational activity hasn't been presented as a completed commercial outcome.
Check the report before sending
Read the summary without looking at the charts. It should tell the owner whether the business is moving toward its goal, what remains uncertain, and what needs approval.
Then check the proposed work against the evidence. A task belongs in the roadmap because it addresses a diagnosed problem or opportunity, not because the team needs something to list as next month's activity.
Keep the cadence consistent, and preserve definition changes in a visible note. The most useful report isn't the longest one. It's the one another person can verify and act on without reconstructing your reasoning.
Up North Media's monthly SEO reporting tracks organic traffic, keyword rankings, conversion rates, and ROI alongside ongoing optimization. To build a reporting baseline for your site, visit Up North Media and submit the short audit form with your website and market; we'll reply within one business day to confirm scope and pricing.